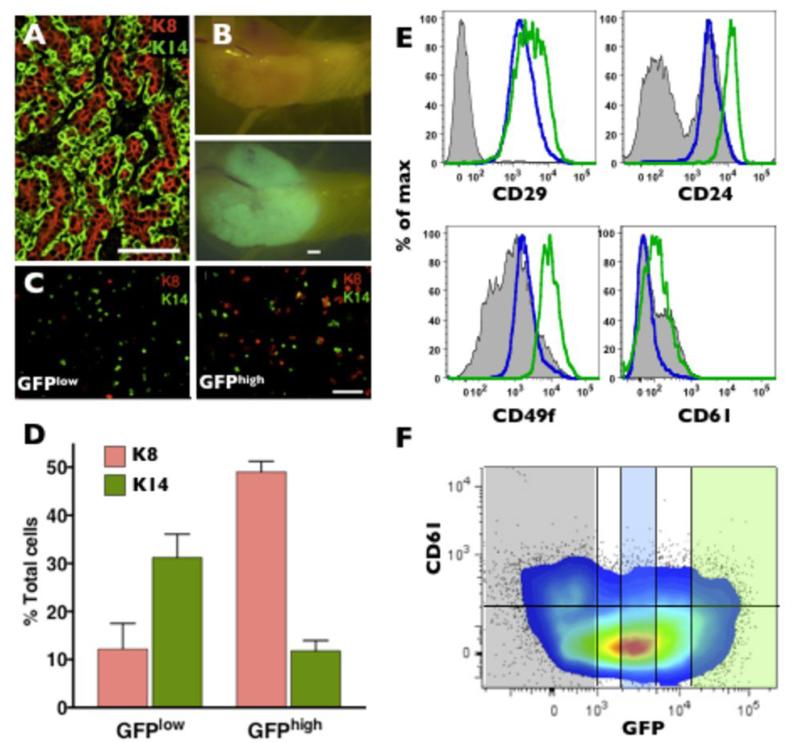
Figure 4. Heterogeneous expression of GFP in MMTV-Wnt1/MELK-GFP bitransgenic tumors.
A, immunostaining for K8 and K14 in a wild-type MMTV-Wnt1 tumor. Scale bar 50μm. B, whole mount bright field and green fluorescent images of a bitransgenic tumor. Scale bar 50μm. C and D, immunostaining (scale bar 50μm) and quantification of K8 and K14 expression in GFPHigh and GFPLow fractions of GFP Wnt1 tumors. GFPLow and GFPHigh cells express significantly different levels of K8 and K14, p=0.003 and p=0.0215, respectively, n=3. E, flow cytometry analysis of stem/progenitor marker expression in GFPnegative(grey area), GFPlow(blue line), and GFPhigh (green line) cells from a MMTV-Wnt1/MELK-GFP bitransgenic tumor. Note GFPhigh cells express elevated CD24, CD49f, CD61 as compared to GFPlow cells. F, flow cytometry analysis (colored dot plot 5% probability with outliers) of CD61 vs GFP expression in MMTV-Wnt1/MELK-GFP bitransgenic tumor. Semi-transparent shaded areas correspond to GFPhigh (green), GFPlow (blue), and GFPnegative (grey) populations. Horizontal line denotes the level of background fluorescence (CD61 negative cells).

