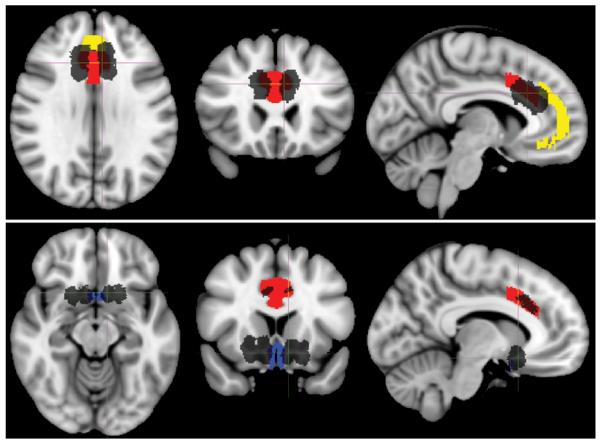
Figure 7.
Representative lesion masks with selected Center for Morphometric Analysis structural atlas ROIs. Lesions are shown in black. Selected ROIs are anteromedial cingulate gyrus, Brodmann area 24 (red); paracingulate cortex, Brodmann area 32 (yellow); paraterminal gyrus, Brodmann area 25 (blue). Lesions and ROIs are displayed on the T1-weighted MNI152 template. Upper: Anterior cingulotomy. Axial, coronal, and sagittal images (left to right). Lower: Limbic leucotomy. Axial, coronal, and sagittal images (left to right).

