
Figure 5. Autophagy contributes to tau clearance in neuronal cells.
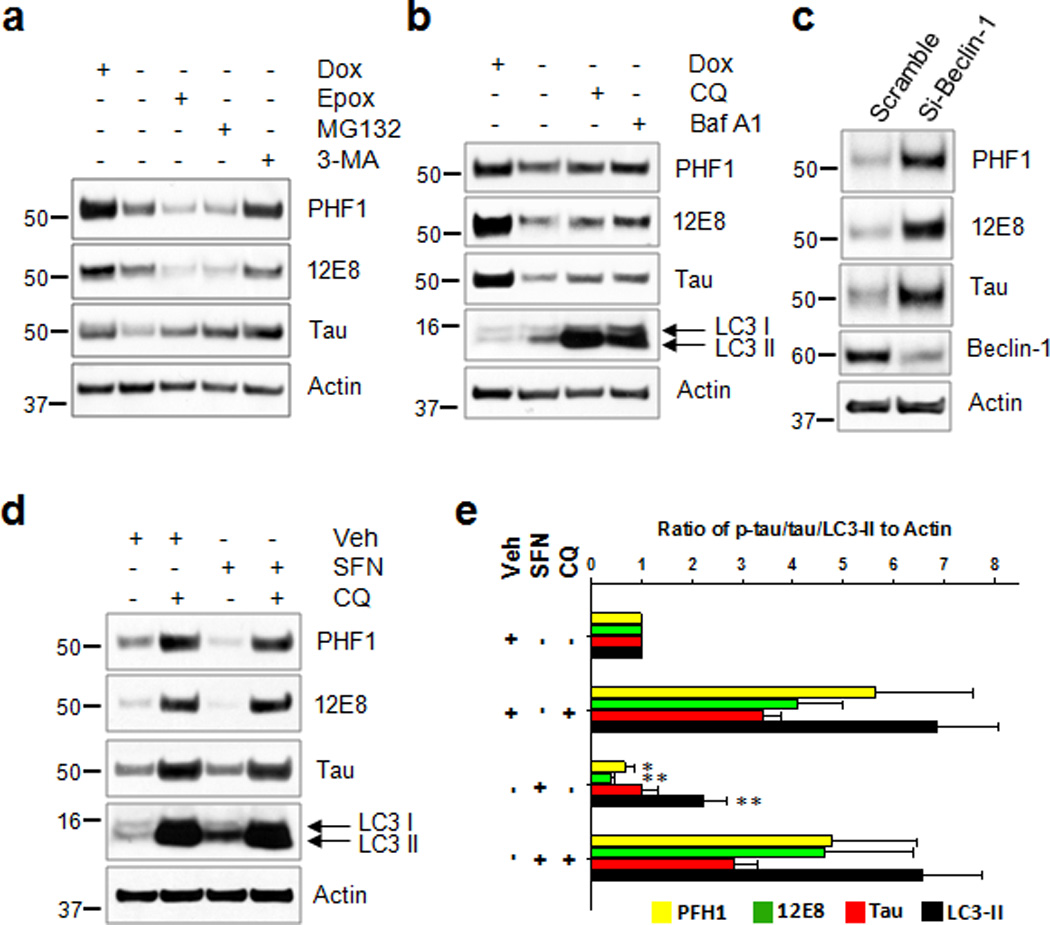
CN1.4 mouse cortical neurons stably expressing inducible tau were treated with doxycycline (Dox, 1 ug/ml) for 24 h. On the next day (a) the cells were washed twice with PBS, and the media were replaced with doxycycline-deficient media with either vehicle, epoxomicin (12.5 nM, Epox), MG132 (7 µM) or 3-methyladenine (10 mM, 3-MA) for 24 h. (b) Cells were treated with either chloroquine (50 µM, CQ) or bafilomycin A1 (10 nM, Baf A1) for 24 h. Samples in first lane were from cells maintained in the presence of Dox without medium exchange. (c) HEK293-TN cells were co-transfected with the plasmid expressing tau together either with siRNA of beclin-1 or scramble RNA as a control, which was kept for 48 h. (d) Stably transfected CN1.4 cortical neurons were maintained in the presence of doxycycline (1 µg/ml) to induce the expression of tau for 24 h, and subsequently treated with sulforaphane (10 µM, SFN) for 12 h. The culture media was exchanged for fresh media containing doxycycline (1 µg/ml) but no SFN after washing with PBS. The cells were then incubated for an additional 18 h in the absence or presence of chloroquine (50 µM, CQ). The levels of tau phosphorylated at Ser262/Ser356 and Ser396/Ser404 were analyzed by immunoblotting using the 12E8- and PHF1 antibodies, respectively. Tau, beclin-1 and LC3 were detected with the appropriate polyclonal antibodies. The relative molecular masses (kD) are indicated to the left of each blot. (e) Bar graphs represent the relative optical density of phosphorylated tau, tau or LC3-II normalized with that of actin. n=4. Data shown are mean±SE and were analyzed using Student’s t test. (*, p<0.05; **, p<0.01)