
Figure 6.
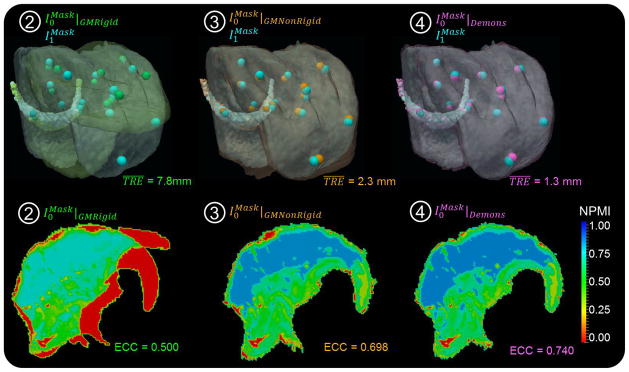
Registration accuracy. The TRE, global ECC, and local NPMI are shown following each step of the registration framework: ➁ GM rigid; ➂ GM nonrigid; and ➃ Demons. The first row shows semi-opaque overlays of the VOI in fixed and moving images, and the second row shows sagittal slices of NPMI maps.