Fig. 2.
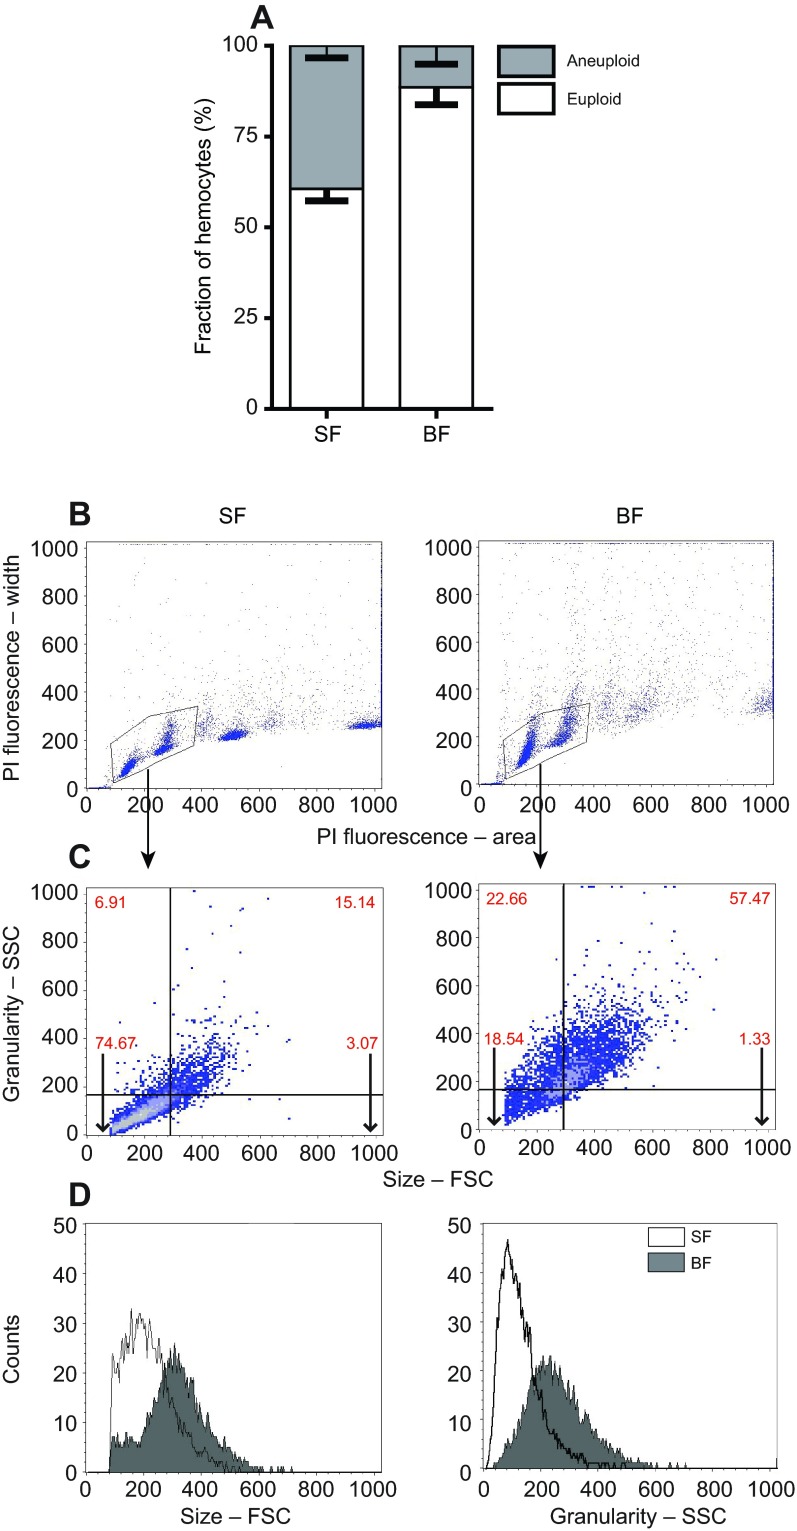
Blood feeding induces changes in hemocyte population and morphology. (A) The percentage of euploid and aneuploid cells obtained from the flow cytometry analyses of PI-stained hemocytes (means ± s.e.m.). (B) Euploid cells were gated and analyzed for their size (FSC) and granularity (SSC). Axes are shown in arbitrary units. (C) Density dot plots illustrating size and granularity (expressed as arbitrary units) and their intensity on a blue to white color scale. (D) Overlaying histograms of sugar-fed and blood-fed euploid hemocytes revealing an increase in average cell size and granularity after a blood meal. Data shown are representative of three independent experiments.

