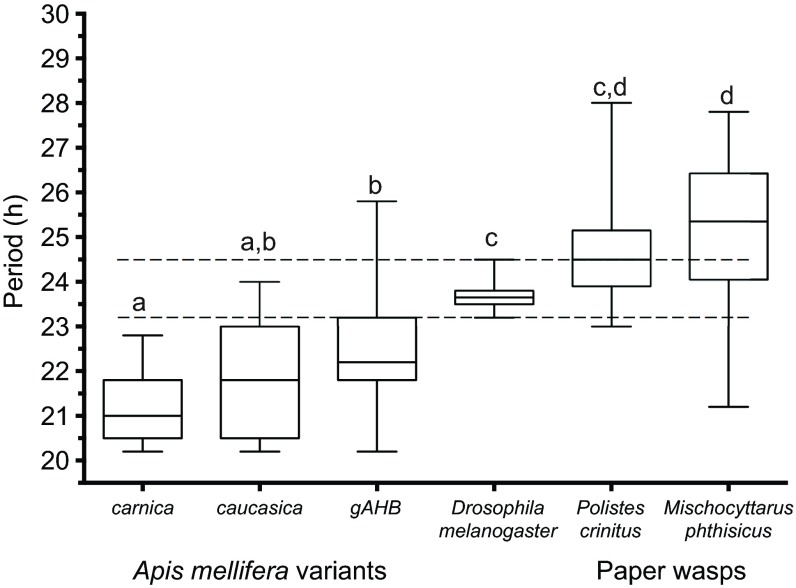
Fig. 4.
The period of honey bees and wasps significantly deviates from 24 h and exhibits a large degree of inter-individual variation. Box plots of the endogenous period distribution in constant darkness for individuals of the A. mellifera subspecies carnica (n=11) and caucasica (n=13) and the hybrid gAHB (n=58); Drosophila melanogaster (n=32); Polistes crinitus (n=13); and Mischocyttarus phthisicus (n=24). The dashed lines represent the calculated minimum and maximum values for circadian period measured from D. melanogaster individuals. A Kruskal–Wallis test revealed significant differences across all of the sampled groups (F5=94.80, P<0.0001). Box plots with different letters are significantly different at P<0.05 level in a post hoc Tukey's HSD tests.

