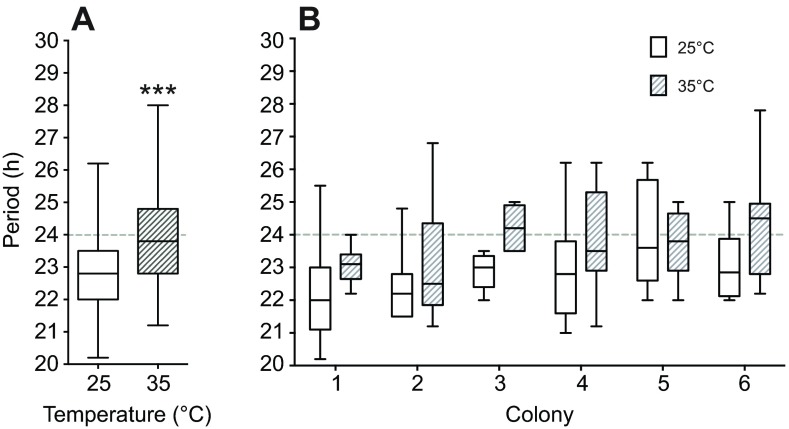
Fig. 5.
Testing the endogenous rhythm at 35°C decreases period deviations from 24 h. (A) Box plots of the endogenous rhythm distribution under constant darkness of honey bee foragers at 25°C (white; n=51) and 35°C (shaded; n=54) reveal significant differences (Kruskal–Wallis test, F5=26.41, P<0.01). (B) Examining the endogenous rhythm at different temperatures of foragers in six different colonies reveals significant differences of the period distributions at different temperatures for colonies 1 (P=0.04), 3 (P<0.01) and 6 (P=0.04), while comparison of these conditions in colonies 2, 4 and 5 did not yield significant differences.

