
Figure 5.
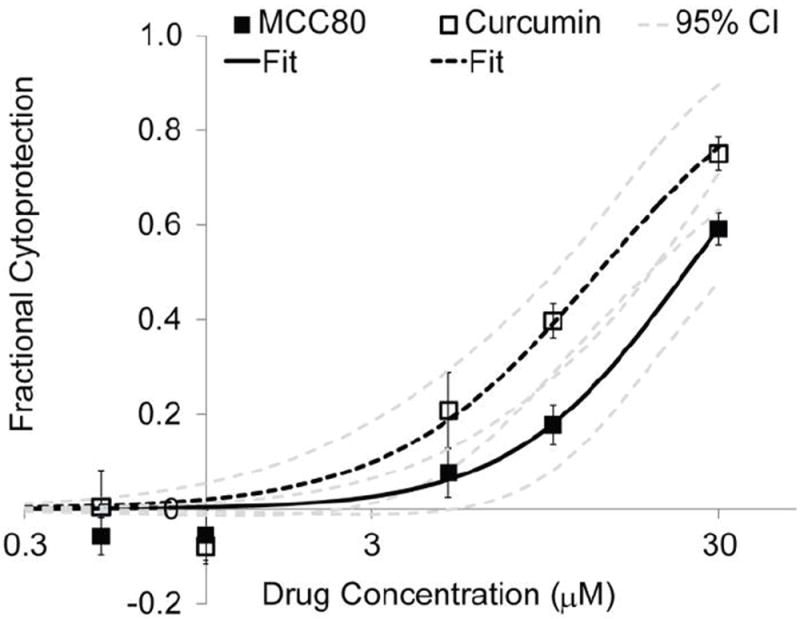
Dose-dependent anti-TNFα bioactivity of MCC80 and curcumin in the L929 cytoprotection assay. Data was fit by nonlinear least-squares regression to Equation 1 to calculate IC50 values. The IC50 of MCC80 was almost 2-fold higher than curcumin; however, the 95% confidence intervals for each drug overlap substantially. MCC80 numerical fit: b = 237.6; k = 1.72; IC50 = 24.1 μM [19.1, 32.0]; R2 = 0.98. Curcumin numerical fit: b = 45.95; k = 1.472; IC50 = 13.5 μM [10.1, 19.0]; R2 = 0.98. Brackets indicate 95% CI.