
Figure 1. Differential expression analysis.
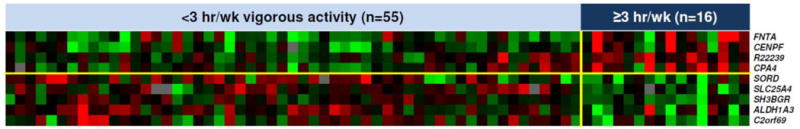
Heatmap showing up-regulated (red) genes (upper right quadrant) and down-regulated (green) genes (lower right quadrant) in normal prostate of 71 men with low-risk prostate cancer who participated in ≥3 h/wk vigorous activity compared to men who engaged in <3 h/wk vigorous activity.