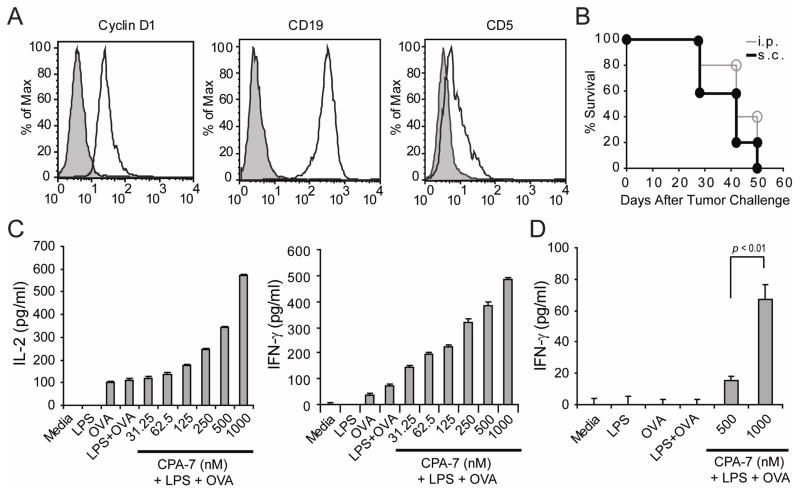
Figure 4. Phenotypic and functional characteristics of FC-muMCL1 cells.
(A) Expression of Cyclin D1, CD19 and CD5 by FC-muMCL1 cells (open histogram). Gray histogram: Isotype control. (B) In vivo growth of FC-muMCL1 tumors. C57BL/6 mice were injected either sc in the right leg (closed circles) or ip (open circles) with 5×10⁶ FC-muMCL1 cells. Five mice were included in each group and they were inspected three times a week for the development of tumor nodules (sc model) or abdominal girth (ip model). Shown is a representative experiment of two with similar results. (C–D). Antigen-presenting function of MCL cells. FC-muMCL1 cells (1×10⁵ cells/well) were treated with LPS (2 mcg/ml), LPS + increasing concentrations of CPA-7, or left untreated (Media) for 24 hours. Then, cells were washed and plated with either 5×10⁴ naïve anti-OVA CD4+ T-cells/well or tolerized anti-OVA CD4+ T-cells isolated from mice bearing an OVA-expressing tumor together with 3mcg/ml of OVA peptide323-339. Forty-eight hours later supernatants were collected and the production of IL-2 and IFN-γ by naïve T-cells (C) and the production of IFN-γ by tolerized T-cells (D) were determined by ELISA. Shown is a representative experiment of three independent experiments with similar results (*p statistically significant for the difference in cytokine production between treatment).

