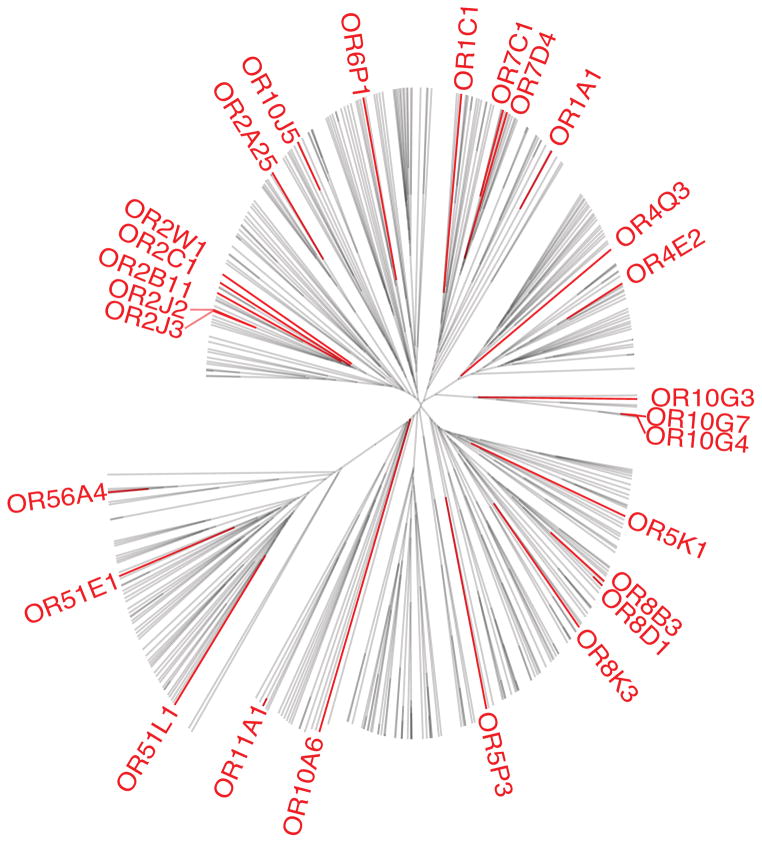
Figure 2.
Unrooted tree based on similarity of amino acid properties. 27 odorant receptors with agonists are highlighted in red, and represent 9 of the 13 odorant receptor gene families. Grantham’s amino acid property scales were used to quantify receptor similarity30 and distances were calculated using the unweighted pair group method with arithmetic mean (UPGMA).

