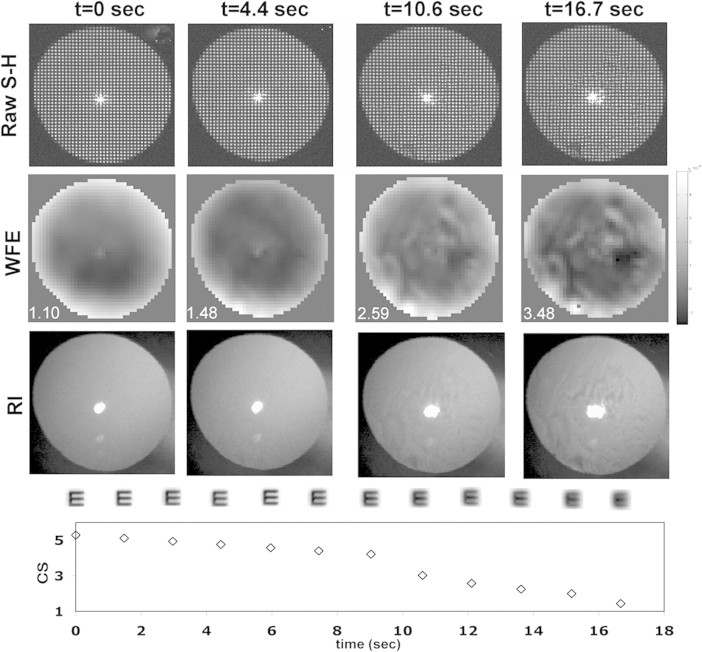
Figure 3.
A time-series collected from one trial. Top row: four raw S-H images collected at 0, 4.4, 10.6, and 16.7 seconds during a blink-suppression trial. Rows 2 and 3: the corresponding zonal reconstructed WFE map and RI images, respectively. The RMS fit error of each wavefront (in microradians) is show on the bottom left corner of each image in the second row. The fourth row shows the simulated retinal image for a 20/40 letter E derived from the wavefront map shown in row 2. Bottom row: the simultaneously measured CS.

