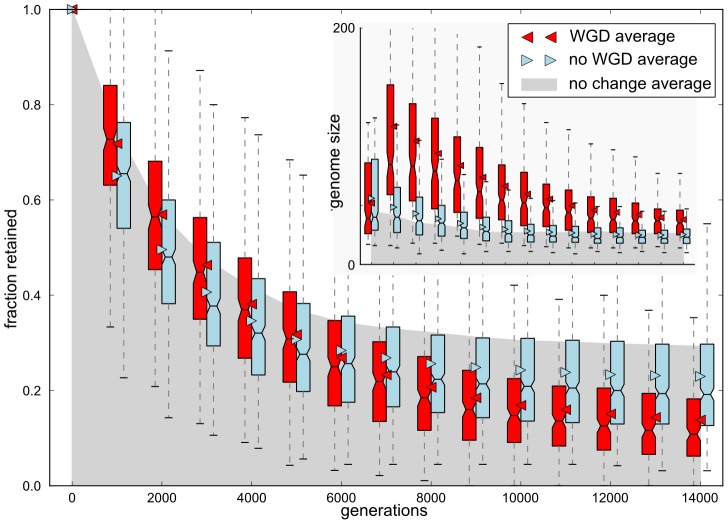
Figure 3. Fraction of conserved ancestral gene content through evolutionary time.
The gene content of ancestors at the time of environmental switch was used as reference. At 1000 generation intervals, the overlap in gene content of descendants with the reference was measured. All genes inherited one to one from the ancestral reference (not counting copies from subsequent duplication events) count towards the retained fraction of the total ancestral gene content, in WGD lineages (red), non-WGD lineages (blue) and a neutral control set where the environment was kept the same (gray). Boxes and whiskers show the 50% (box) and 75% (whiskers) ranges of the data around the median (line). Triangles and the upper edge of the shaded area show the averages of the environmental change and neutral evolutionary runs, respectively. The inset shows the distribution of genome sizes.

