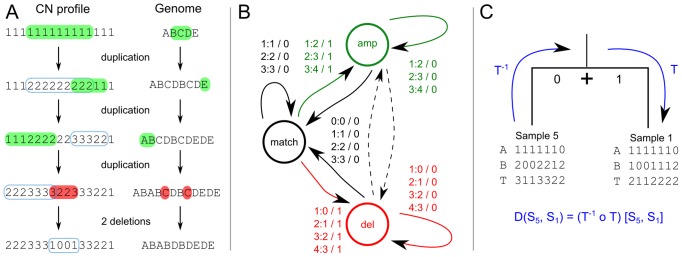
Figure 3. Efficient distance calculation is enabled via a transducer architecture.

A) Overlapping genomic rearrangements modify the associated copy-number profiles in different ways. Amplifications are indicated in green, deletions in red. The blue rectangles indicate the previous event. B) The one-step minimum event transducer describes all possible edit operations achievable in one event. This FST is composed  times with itself to create the the full minimum event FST
  . Edge labels consist of an input symbol, a colon and the corresponding output symbol, followed by a slash and the weight associated with taking that transition. C) The minimum event FST
  is asymmetric and describes the evolution of a genomic profile from its ancestor. Composed with its inverse this yields the symmetric minimum event distance
  .
.
