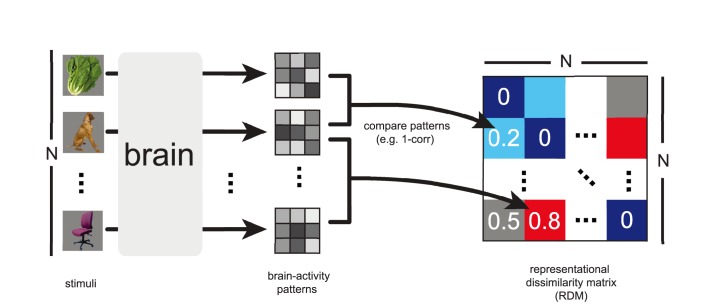
Figure 1. Computation of the representational dissimilarity matrix (RDM).
During the experiment, each subject's brain activity is measured while the subject is exposed to N experimental conditions, such as the presentation of sensory stimuli. For each brain region of interest, an activity pattern is estimated for each experimental condition. For each pair of activity patterns, a dissimilarity is computed and entered into a matrix of representational dissimilarities. When a single set of response-pattern estimates is used, the RDM is symmetric about a diagonal of zeros. The dissimilarities between the activity patterns can be thought of as distances between points in the multivariate response space. An RDM describes the geometry of the representation and serves as a signature that can be compared between brains and models, between different brain regions, and between individuals and species.

