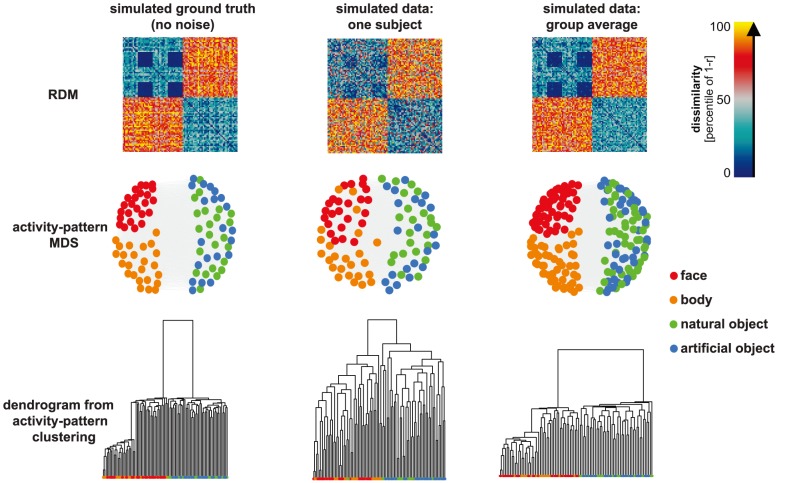
Figure 2. Visualizing representations as RDMs, 2D arrangements, and clustering dendrograms.
Percentiled RDMs are displayed in the top row. The left RDM corresponds to the simulated ground truth (dissimilarities measured before adding noise). The middle RDM is an example of a simulated single-subject RDM (dissimilarities measured after adding isotropic Gaussian noise to the ground-truth patterns). The group-average RDM (right) is computed by averaging the RDMs for all 12 simulated subjects, which reduces the noise. Visual inspection reveals the simulated structure designed here to be similar to the human-IT RDM from Kriegeskorte et al. [19], with two main clusters corresponding to animate and inanimate objects and a cluster corresponding to human and animal faces. Two-dimensional arrangements (middle row, computed by MDS with metric stress criterion) provide a spatial visualization of the approximate geometry, without assuming any categorical structure. The third row displays the results of hierarchical agglomerative clustering to the three RDMs. Clustering starts with the assumption that there is some categorical structure and aims to reveal the categorical divisions. MDS plots and dendrograms share the same category color code (see color legend).

