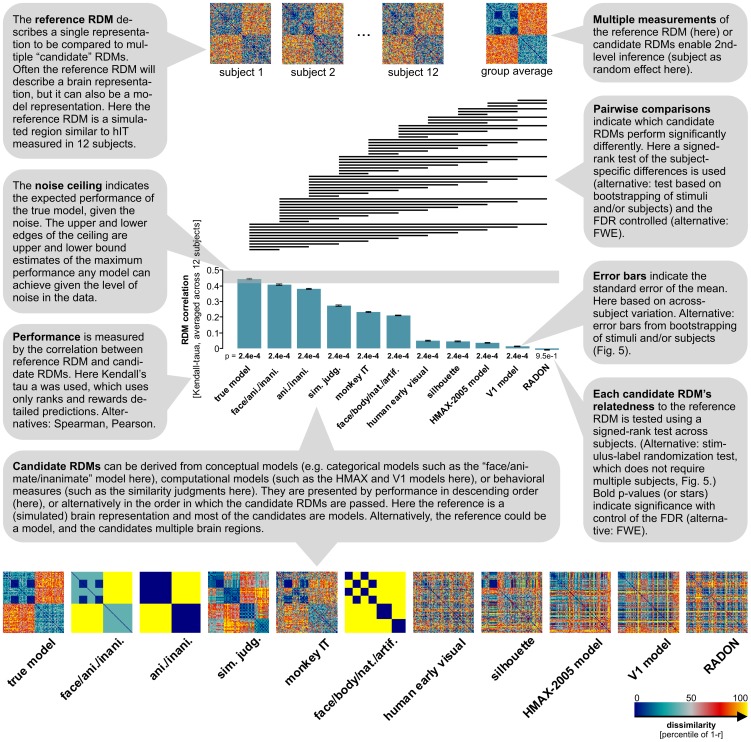
Figure 4. Simulated representation – inferential comparisons of multiple model representations.
Several candidate RDMs are tested and compared for their ability to explain the reference RDM. As expected, the true model corresponding to the simulated ground truth (no noise) is the most similar candidate RDM to the reference. Note that the true model falls within the ceiling range, indicating that it performs as well as any possible model can, given the noise in the data. The second best fit among the candidate RDMs is the categorical model with some extra information about the within-animate category structure. This model reflects the categorical clustering in the simulated data, but misses the simulated within-category structure. A horizontal line over two bars indicates that the two models perform significantly differently. The pairwise statistical comparisons show that the true model is significantly better than all other candidate RDMs. Most of the other pairwise comparisons are significant as well, illustrating the power of the signed-rank test used for comparing candidate performances in this simulated scenario. Kendall's τA is used as a measure of RDM similarity, because candidates include categorical models (i.e. models predicting equal dissimilarities for many pairs of stimuli). Other rank-correlation coefficients overestimate the performance of categorical candidate RDMs (Figure S2 in Text S1). All candidate RDMs except that obtained from the RADON model are significantly related to the reference RDM (p values from one-sided signed-rank test across single-subject estimates beneath the bars).

