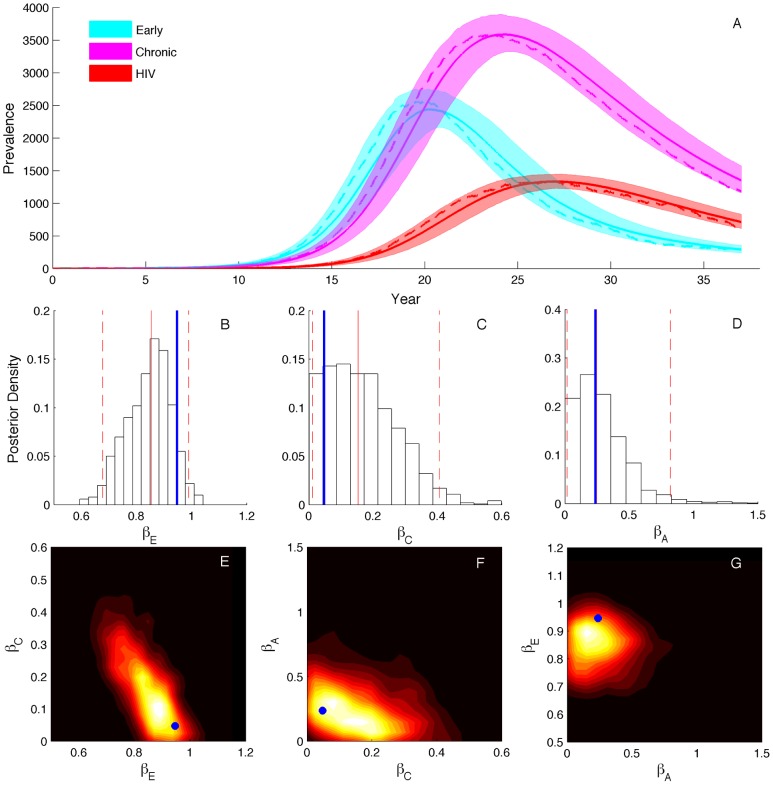
Figure 1. Prevalence and transmission rates estimated from a representative genealogy simulated under the three-stage SIR model.
(A) Stage-specific prevalence estimates with the 95% credible intervals shaded and the posterior medians shown as solid lines. Dashed lines show the true prevalence. (B–D) The marginal posterior densities of the stage-specific transmission rates. (E–G) The corresponding pairwise joint densities of the transmission rates, which were constructed from the MCMC samples using nonparametric kernel density estimation.

