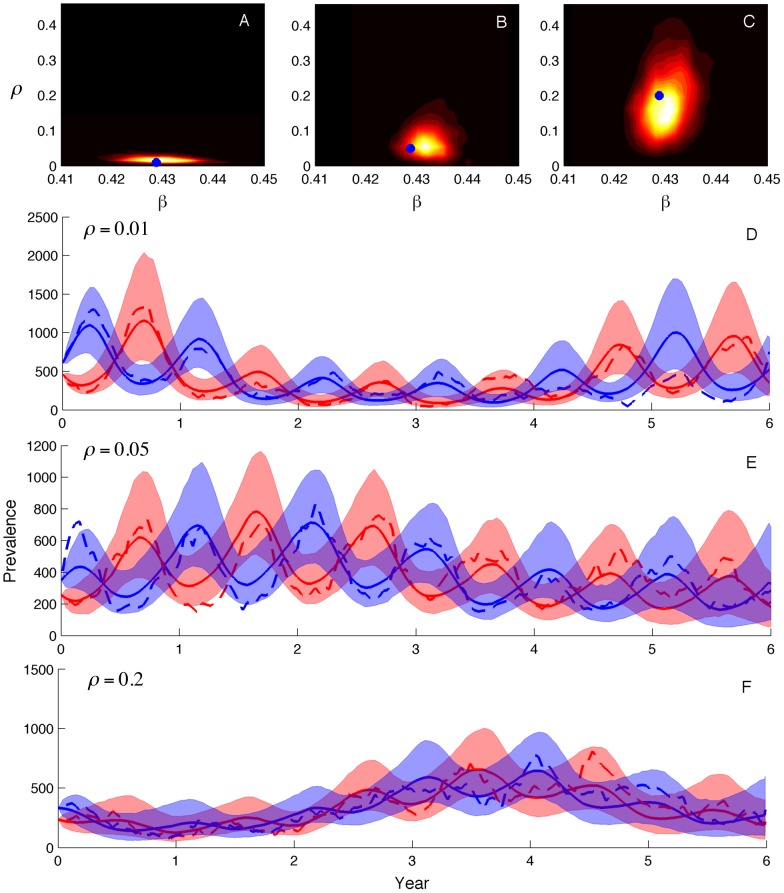
Figure 4. Parameter and prevalence estimates for the two-population model.
Mixing rates between the two populations were varied from low ( ), medium (
 ) to high (
 ). (A–C) Joint posterior densities for the transmission rate
  and the mixing parameter
  . (D–F) Prevalence estimates for the two populations with the 95% credible intervals shaded and the posterior medians shown as solid lines. Dashed lines show the true prevalence. Initial conditions for the number of susceptible and infected individuals in each population were fixed at their true values for these simulations.

