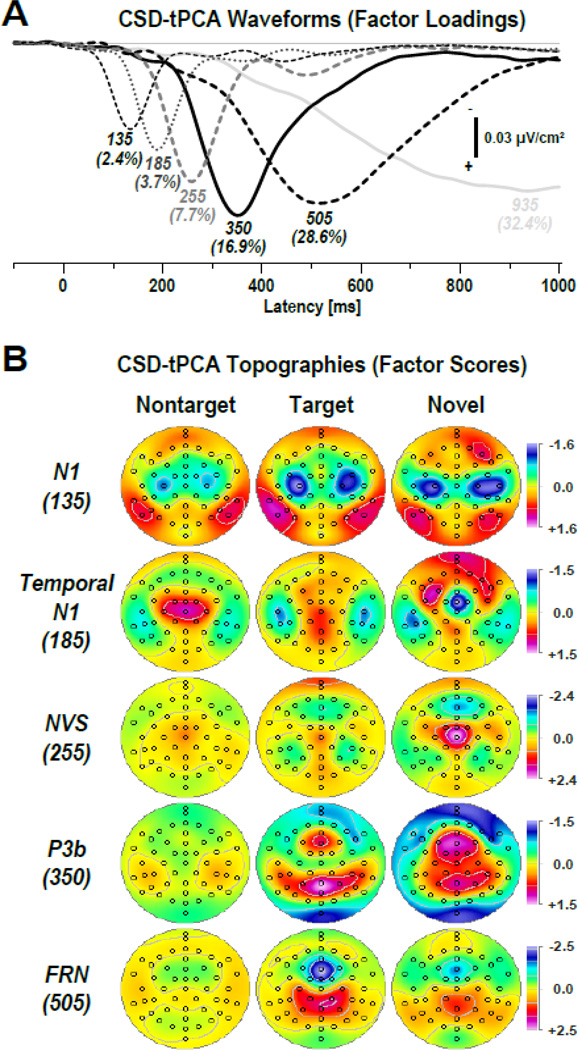
Figure 4.
(A) Factor loadings of the first six temporal PCA (tPCA) factors (with explained variance) extracted from the time-locked CSD waveforms (N = 42). Factor labels reflect the peak latency [ms] of the factor loadings. (B) CSD factor score topographies corresponding to N1 sink (135 ms peak latency of factor loading), temporal N1 sink (185 ms), novelty vertex source (NVS; 255 ms), P3b source (350 ms), and frontal response negativity (FRN; 505 ms) comparing nontarget, target and novel stimuli (pooled across all 42 participants; for separate topographies for each group, see supplementary Fig. S1). All topographies are two-dimensional representations of spherical spline interpolations (m = 2; λ = 0) derived from the mean factors scores for each recording site.

