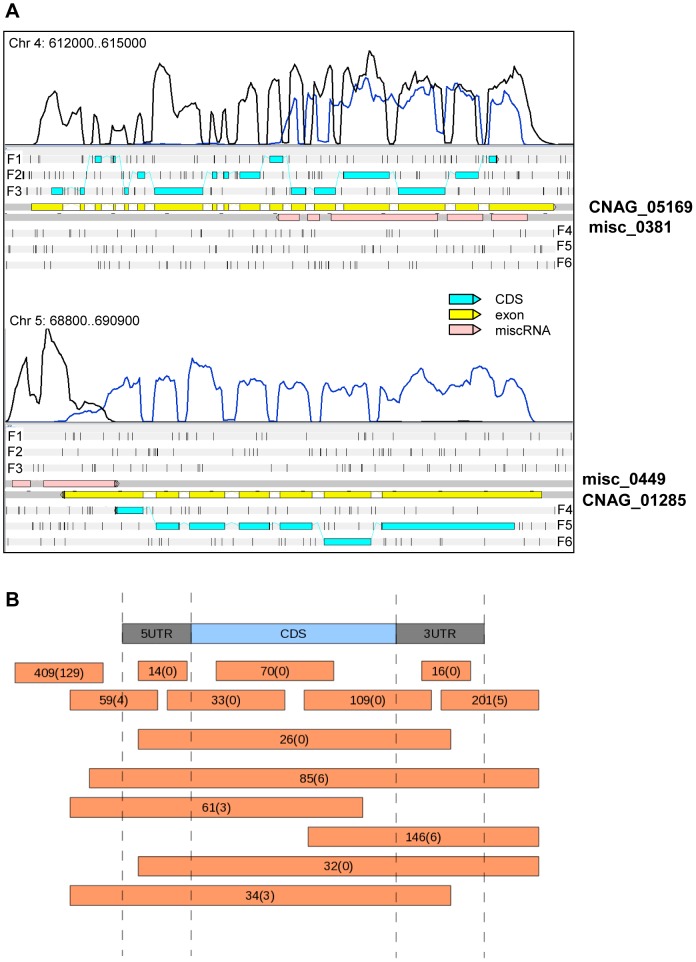
Figure 4. miscRNAs in C. neoformans var. grubii.
A. Two examples of a miscRNA as visualized through Artemis. The coverage of the plus stand is represented by the black curve. The coverage of the minus strand is represented by the blue curve. These results were obtained when cells grown in low glucose and nitrogen medium (starvation medium) underwent strand-specific sequencing. F1, F2, and F3 stand for 5′ to 3′ frames 1, 2, and 3, respectively. F4, F5, and F6 stand for 3′ to 5′ frames 1, 2 and 3, respectively. The small black vertical bars indicate the position of the stop codons for each frame. B. Schematic representation of the positions of the miscRNAs in the C. neoformans var. grubii genome as compared to coding sequences. The numbers of miscRNAs at each position is indicated. The number of miscRNAs in the antisense strand of other miscRNAs is indicated between brackets.

