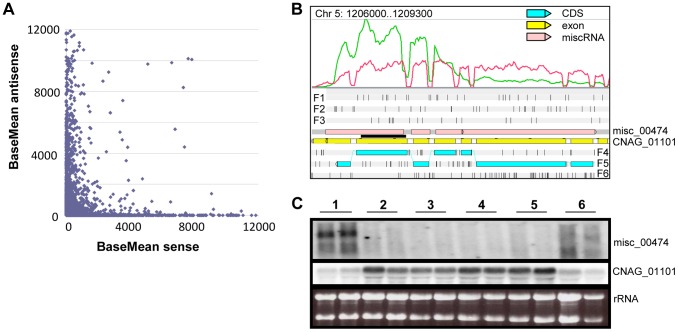
Figure 8. Antisense/sense transcription in C. neoformans var. grubii.
A. Comparison of sense/antisense transcription when an antisense transcript is present. Strand-specific data obtained from cells grown on YPD is shown. The BaseMean values represent the normalized reads count for each transcript and measure the level of sense transcription (x axis) and antisense transcription (y axis) as calculated by DESeq [126]. Outliers with a BaseMean above 12,000 were not represented. B. Example of differential expression of miscRNA antisense of a coding gene as observed through Artemis. The red curve represents the non-strand-specific coverage observed when cells were grown in YPD to stationary phase at 30°C (condition 1); the green curve shows the non-strand-specific coverage observed when the cells were grown in YPD to log phase at 30°C (condition 2). F1, F2, and F3 stand for 5′ to 3′ frames 1, 2, and 3, respectively. F4, F5, and F6 stand for 3′ to 5′ frames 1, 2, and 3, respectively. The small black vertical bars indicate the position of the stop codons for each frame. C. Northern blot obtained after hybridization with strand-specific probes. RNA was extracted from cells growing in YPD (2×10⁸ cells/mL) at 30°C (condition 1), YPD (5×10⁷ cells/mL) at 30°C (condition 2), YPD with 0.01% SDS (5×10⁷ cells/mL) at 30°C (condition 3), YPD with 10 mg/mL fluconazole (5×10⁷ cells/mL) at 30°C (condition 4), YPD (5×10⁷ cells/mL) at 37°C (condition 5), and YP galactose (2×10⁸ cells/mL) at 30°C (condition 6) in duplicate. Then, 5 µg RNA were loaded on a denaturing electrophoresis agarose gel, electrophoresed, and transferred to a nylon membrane. The horizontal black line represents the position of the probes.

