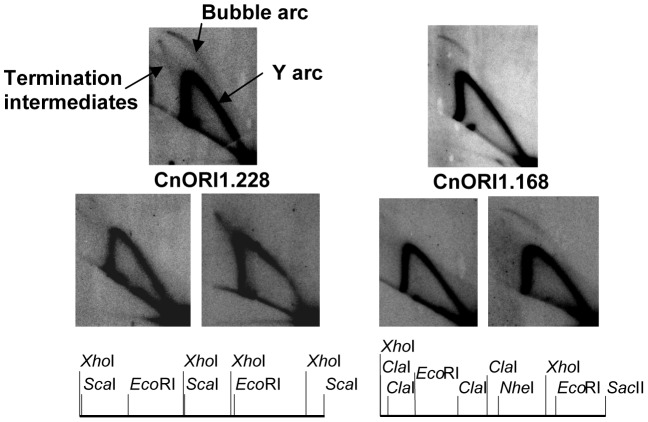
Figure 10. Identification of replication origins.
The two sets of three panels show 2D gel patterns of replication intermediates in the regions of CnORI1.168 and CnORI1.228, as diagramed below. The arcs of bubble-shaped replication intermediates, Y-shaped replication intermediates, and replication intermediates are labeled on the upper left panel. The upper autoradiogram in each set shows the 2D gels of the EcoRI fragments that defined the origins. The two lower autoradiograms in each set show 2D gels of genomic restriction fragments that overlap the EcoRI fragments, also shown in the diagrams below. CnORI1.228: upper panel, 4,722-bp EcoRI fragment; lower left panel, 4,655-bp XhoI fragment overlapping left end of EcoRI fragment; lower right panel, 6,297-bp ScaI fragment overlapping right end of EcoRI fragment. CnORI1.168: Upper panel, 5,728-bp EcoRI fragment; lower left panel, 4,803-bp XhoI-NheI fragment overlapping left end of EcoRI fragment; lower right panel, 4,810-bp ClaI-SacII fragment overlapping right end of EcoRI fragment. See text for details.

