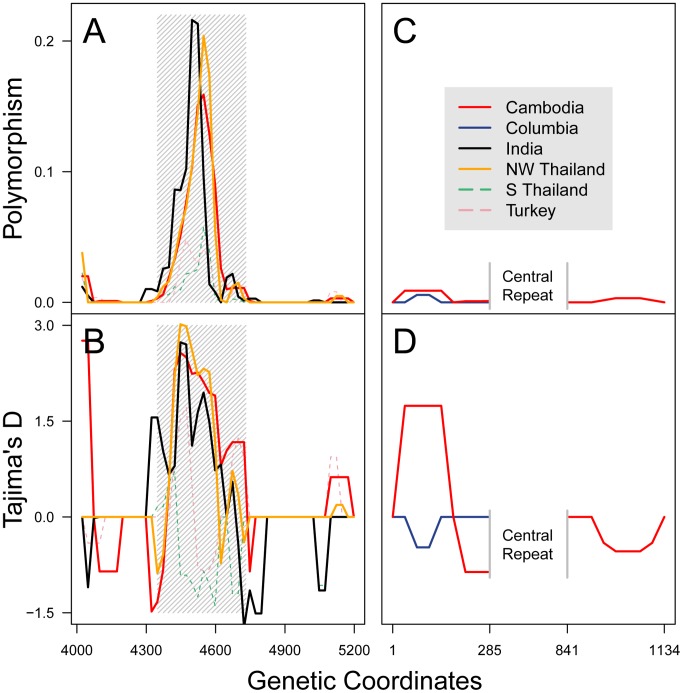
Figure 3. Nucleotide diversity and Tajima's D across the pvmsp-1 42 kDa region and the whole pvcsp gene.
Polymorphism (nucleotide diversity, π) (A) and Tajima's D (B) were calculated across the pvmsp-1 amplicon for five diverse populations. A sliding window (50 bp window and 25 bp step size) was used to achieve a high resolution analysis. Grey hatches demark the intervening region (nucleotides 4348–4731). For pvcsp, N-terminal and C-terminal non-repeat regions were analyzed for nucleotide polymorphism (C) and evidence of balancing selection (D) using a sliding window. Putatively panmictic populations are marked with a solid line, while populations known to be subject to strong selective forces are marked with dotted lines. All coordinates are based on Sal1 pvmsp-1 and pvcsp reference sequences.

