
Figure 3. Response prediction plots of the high-quality surrogate models obtained with SR.
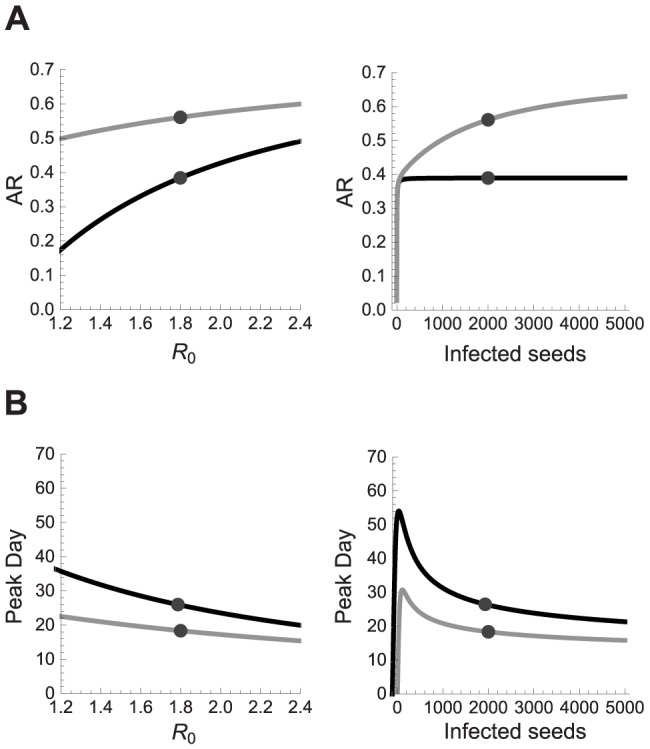
Response prediction plot for the cumulative clinical attack rate (A) and the day on which the epidemic reaches its peak (B) when seeding occurs only once (black) or on a daily basis (gray). Predictions for  assume a fixed number of infected seeds, indicated by the dot in the panel on the right, and vice versa.