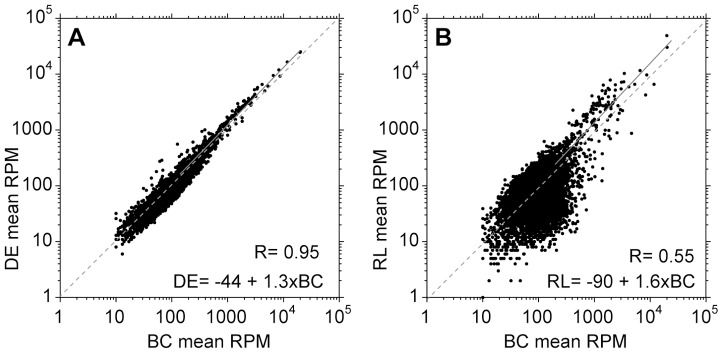
Figure 2. Column purification and erythrocyte lysis cause transcriptome changes.

For each condition: buffy coat (BC), DEAE purification (DE) and erythrocyte lysis (RL), and for each unique open reading frame, the arithmetic mean for three independent experiments was calculated. A. Mean counts for DEAE samples compared with those for buffy coat samples. The diagonal dashed grey line is perfect correlation, and the solid grey line shows the linear regression line for which the formula is shown in the bottom right. B. Mean counts for erythrocyte lysis samples compared with those for buffy coat samples. Analysis as in (A).
