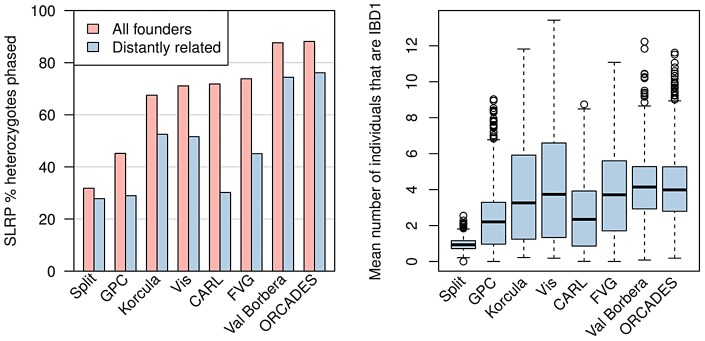
Figure 2. Summary of IBD sharing in cohorts.

Left: The proportion of heterozygote sites phased by SLRP for all individuals (pink) and when individuals with close relatives ( ) are removed (blue). Right: The distributions of the average number of “surrogate” parents for each cohort when closely related pairs (
 ) are removed.
