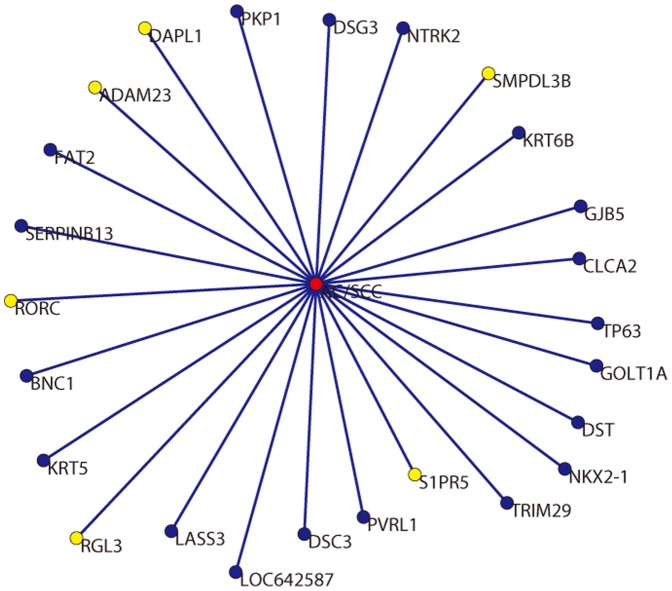
Figure 2. 25 genes are related with the subtypes of NSCLC.
There are  genes related with subtypes of NSCLC by lower logic relationships, and each gene attaches a coefficient. The genes are ranked according to coefficients in descending order. The top
  genes are selected to identify biomarkers. The blue nodes represent
  biomarkers identified in this work. The yellow nodes represent six genes which are not related with NSCLC on the NSCLC and normal specimens. The red nodes represent subtypes, i.e. AC and SCC.

