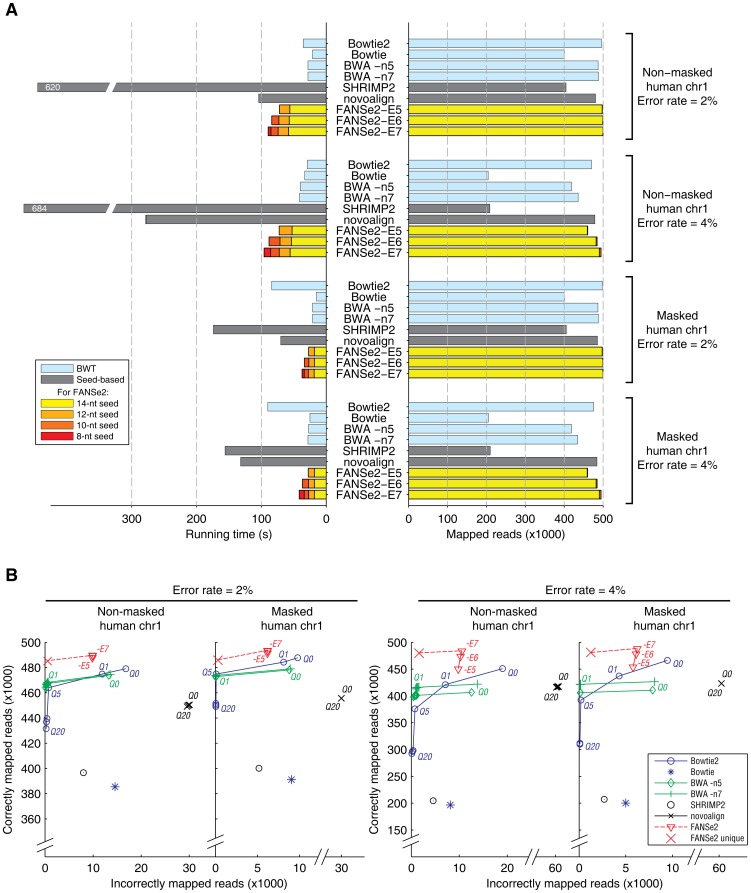
Figure 4. Comparison of FANSe2 and other algorithms on their sensitivity, speed and correctness using simulated datasets from non-masked and masked human chromosome 1 reference sequence (hg19) with 2% and 4% sequencing error rate, respectively.
Each dataset contains 500,000 reads with the length of 75-nt. The test parameters are listed in Table S4 in File S1. (A) Comparative test on sensitivity and speed. Reads mapped and the time used at different stages of seed lengths in FANSe2 are shown in colors. The BWT-based algorithms are shown in light blue bars, and the other seed-based algorithms are shown in gray bars. (B) Comparative test on correctness. For Bowtie2, BWA and novoalign, mapped reads were filtered using various mapping quality threshold (Q0∼Q20) represented in Phred score scale (black circle). The correctness of FANSe2 results were marked on the same plot when considering all mapping results (red triangle, 5∼7 errors allowed) or considering only the reads that were uniquely mapped (red cross, 7 errors allowed). The results of Bowtie and SHRiMP2 were not filtered according to the mapping quality due to their low mapping sensitivity.

