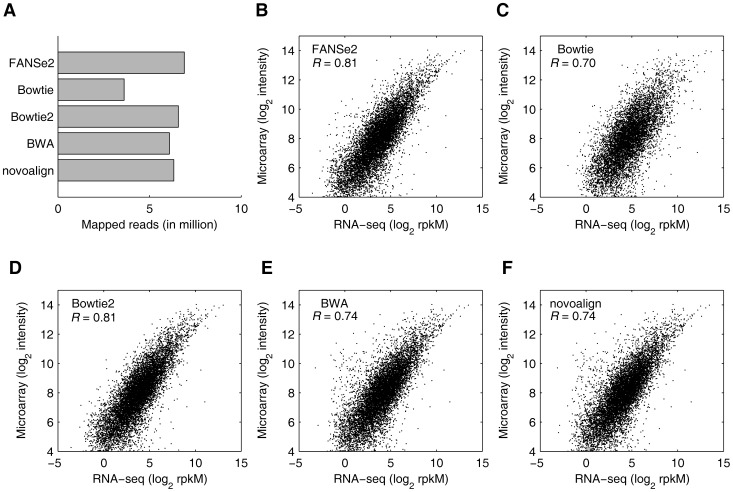
Figure 6. Comparison of the gene expression level calculated by RNA-seq and microarray.
(A) The mapped reads to coding genes (NM_*) by FANSe2, Bowtie, Bowtie2, BWA and novoalign. Three mismatches were allowed in the mapping by FANSe2 and BWA. The results of Bowtie were obtained from GEO database GSE21210 and described by Su et al. [25]. (B–F) Correlations of RNA-seq and microarray. Only the reads that mapped to coding genes were taken into consideration to be consistent to the microarray data. The rpkM values of RNA-seq were calculated from the mapping results by FANSe2 (B), Bowtie (C), Bowtie2 (D), BWA (E) and novoalign (F).

