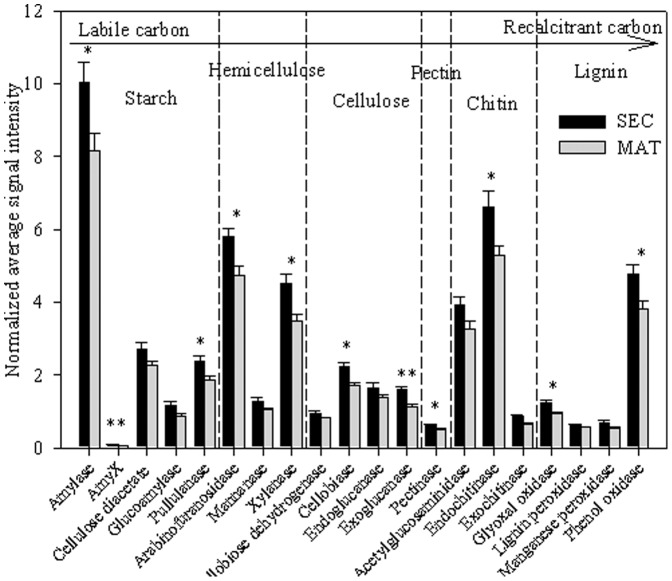
Figure 3. The normalized gene relative signal intensity of the detected key gene categories involved in carbon degradation.
The signal intensities were the sum of detected individual gene for each functional gene, averaged among 4 soil samples. The complexity of carbon is presented in order from active to recalcitrant. All data are presented as mean ± standard error. Significant differences between two forest types are indicated above the bars. *, P<0.05, **, P<0.01.

