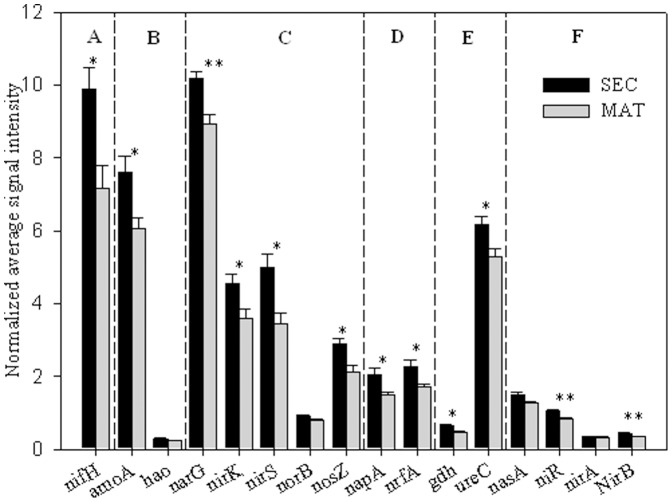
Figure 4. The normalized average signal intensity of detected key gene categories involved in the N cycling between SEC and MAT.
The signal intensities were the sum of all detected individual gene for each gene category, and then averaged among 4 samples. (A). N2 fixation, including nifH encoding nitrogenase; (B). Nitrification, including amoA encoding ammonia monooxygenase, hao for hydroxylamine oxidoreductase; (C). Denitrification, including narG for nitrate reductase, nirS for nitrite reductase, norB for nitric oxide reductase, and nosZ for nitrate reductase; (D). Dissimilatory N reduction to ammonium, including napA for nitrate reductase, and nrfA for c-type cytochrome nitrite reductase; (E). Ammonification, including gdh for glutamate dehydrogenase and ureC encoding urease; (F). Assimilatory N reduction, including nasA encoding nitrate reductase, niR, nirA and nirB encoding dissimilatory nitrite reductase. All data are presented as the mean±SE (error bars). **, P<0.01, *, P<0.05.

