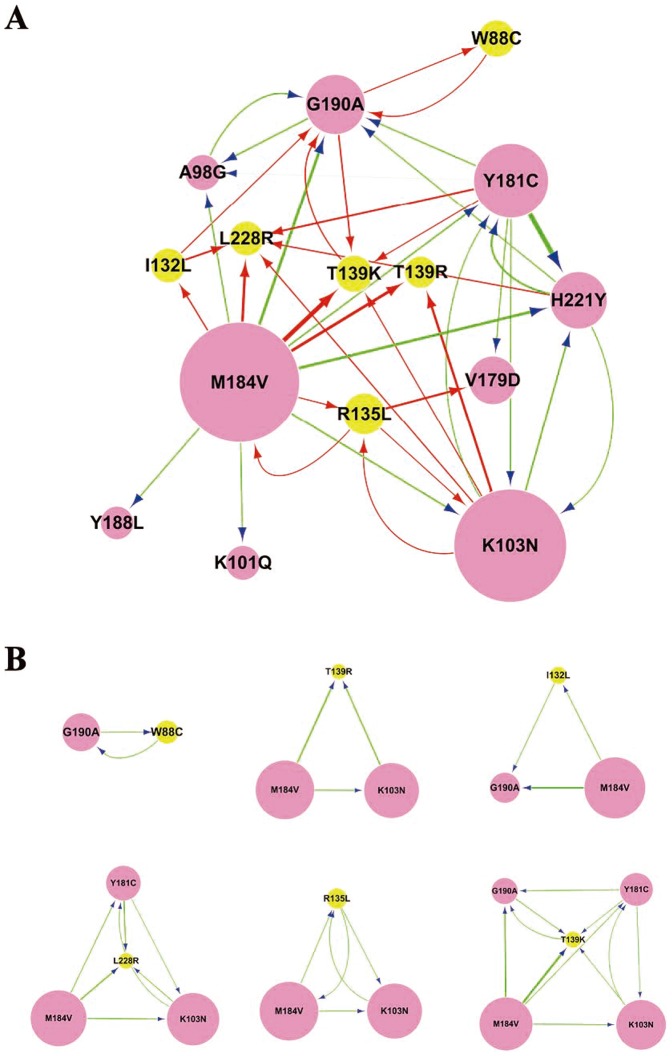
Figure 1. Predicted interaction network of NNRTI-resistance related mutations.
The network in (A) represents the global relationship among the potential NNRTI-resistance related mutations, while (B) shows the relationship between a rare but critical mutation and the well-known RTI-resistance mutations. The rare but critical mutations are highlighted in yellow, and the arrows from the source node to the target node indicate the influence of one site on another. In the network, the size of the node represents the mutation frequency of that site from one amino acid to another, while the width of line represents the strength of influence between two mutations.

