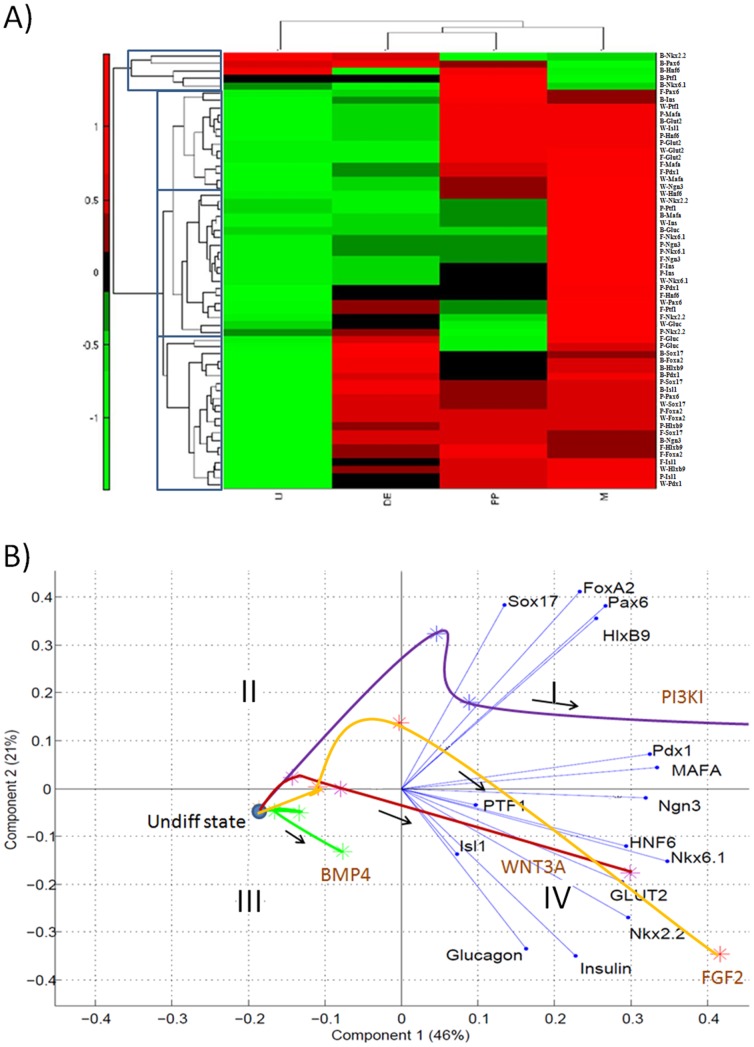
Figure 5. Transcription factor dynamics.
(A) Heat map for the entire data set of genes and conditions illustrating marker progression throughout differentiation stages. The genes are organized according to the expression clusters found through hierarchical clustering. The treatments are denoted on the right hand side as prefixes to the gene names. BMP4 induction condition typically was found to cluster separately from the rest. Hierarchical clustering was performed on the mean centered and variance scaled data of transcription factor dynamics across all the four DE induction conditions. (B) Biplot of transcription factor dynamics assessed by principal component analysis on the mean data-set. The first component shows a demarcation of the undifferentiated and differentiated states. The second component divides the markers according to their expected appearance during in vivo differentiation. The PI3KI curve moves closer to the DE markers, BMP4 curve does not perform well and the WNT3A and FGF2 curves show successful pancreatic maturation.

