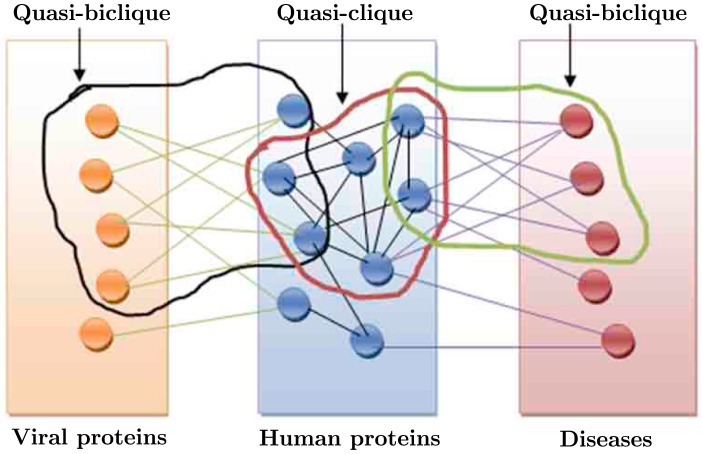
Figure 1. The diagrammatic representation of the proposed study.
The orange circles represent the HCV proteins. The blue circles represent the human proteins. The pink circles represent the diseases. The green edges represent the interaction between HCV proteins and human proteins. The black edges represent the interactions among human proteins. The violet edges represent the associations between human proteins and diseases. The quasi-bicliques and bicliques are shown also. The quasi-biclique in the HCV-human bipartite network overlaps with the quasi-clique in the human protein interaction network. The quasi-clique in the human protein interaction network overlaps with the quasi-biclique in the human protein-disease association network.

