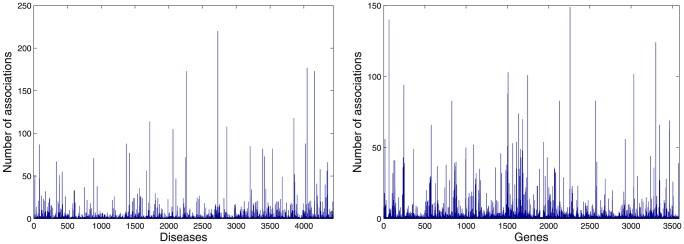
Figure 3. Distribution of associations in the human gene-disease association network.

The left hand side figure shows the distribution of associations with respect to all the disease. The right hand side figure shows the distribution of associations with respect to all the genes.
