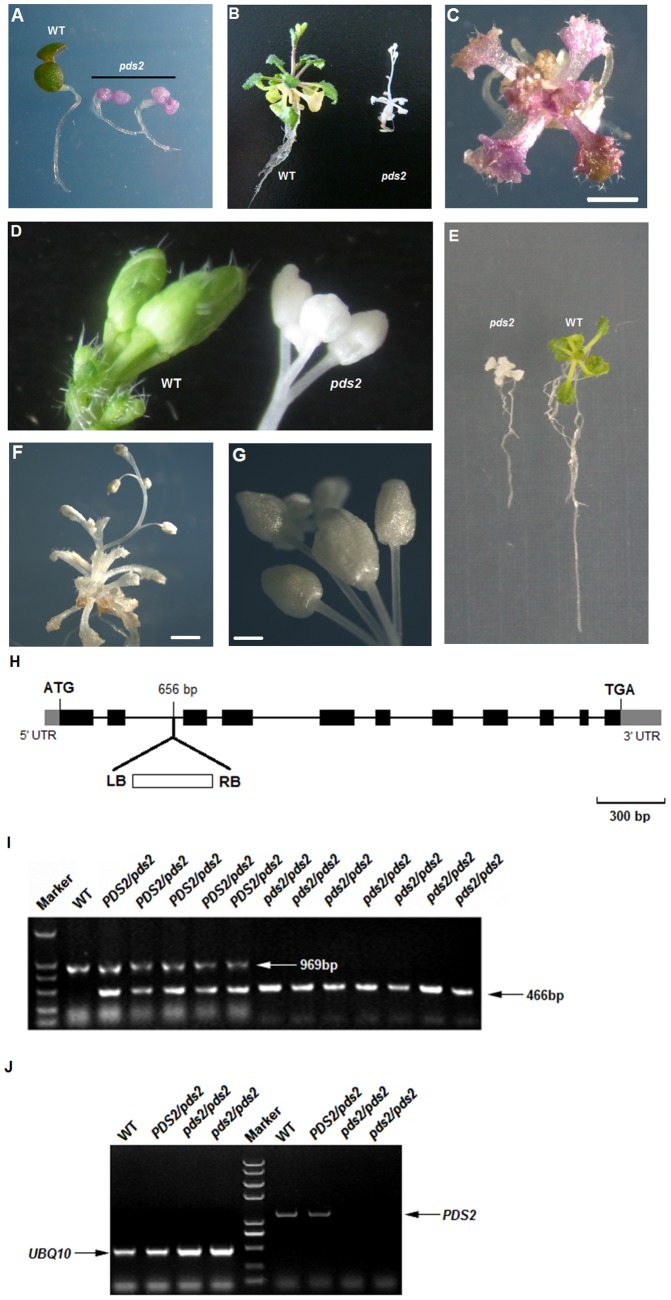
Figure 2. Analysis of pds2-1 mutant plants.
(A) WT and homozygous pds2-1 (T3) seedlings with purple cotyledons grown on ½ strength MS medium for 4 days. (B) Adult homozygous pds2-1 mutant (T3) and WT plants grown on ½-strength MS medium for 4 weeks. (C) A purple T3 pds2-1 mutant seedling. Scale bar = 1 mm. (D) Inflorescences and flower buds from 8-week-old WT and pds2-1 plants. (E) Roots from pds2-1 and WT plants. (F) Adult pds2-1 plant grown on ½ strength MS medium for 8 weeks. Scale bar = 2 mm. (G) Adult inflorescence of a pds2-1 mutant plant. Scale bar = 0.5 mm. (H) HST gene structure and the T-DNA insertion site in pds2-1 mutants. Black boxes: HST gene exons; black lines: HST gene introns. (I) Co-segregation analyses of the HST transgene with pds2-1 mutant phenotypes. Marker: DNA marker; PDS2/pds2: heterozygous pds2-1 mutants; pds2/pds2: homozygous pds2-1 mutants. (J) RT-PCR analysis of the HST gene in WT and pds2-1 mutant plants. The UBQ10 gene was used as an internal control.

