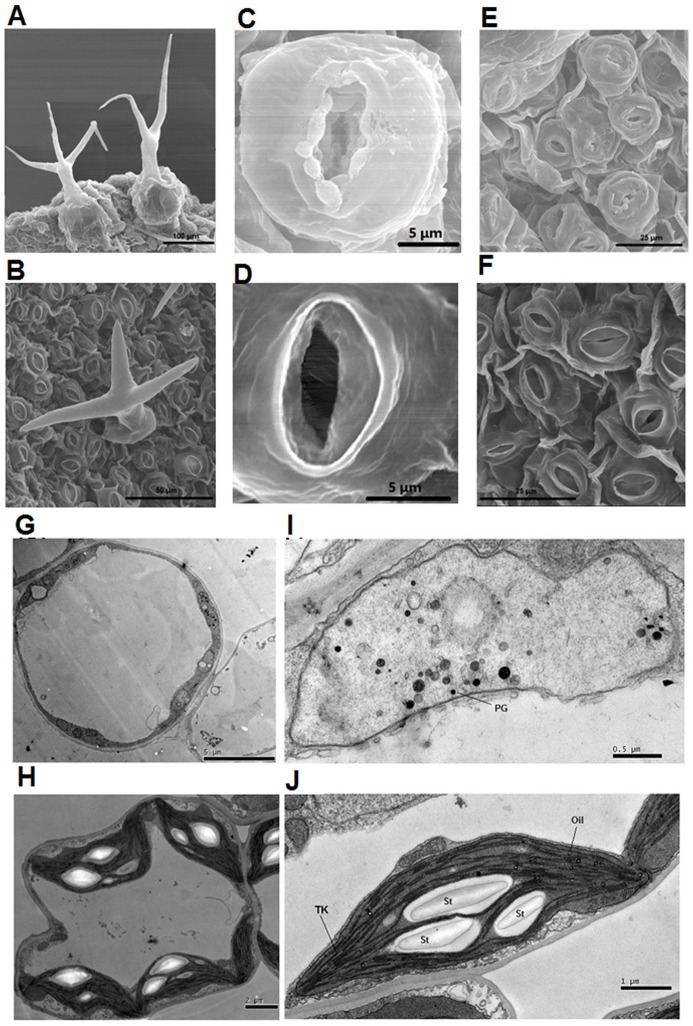
Figure 3. SEM and TEM of mesophyll cells and leaf surfaces of pds2-1 mutant plants.
(A) SEM analysis of trichomes from pds2-1. Scale bar = 100 µm. (B) SEM analysis of the trichomes from a WT plant. Scale bar = 50 µm. (C,D) SEM analysis of stomata from a pds2-1 plant (C) and a WT plant (D). Scale bars = 5 µm. (E,F) SEM leaf surface analysis of a pds2-1 plant (E) and a WT plant (F). Scale bars = 25 µm. (G) TEM analysis of a mesophyll cell from a pds2-1 plant. Scale bar = 5 µm. (H) TEM analysis of a mesophyll cell from a WT plant. Scale bar = 2 µm. (I) TEM analysis of chloroplasts from a pds2-1 plant. PG: plastoglobule. Scale bar = 0.5 µm. (J) TEM analysis of chloroplasts from a WT plant. St: starch granule; Tk: thylakoid; Oil: oil drops. Scale bar = 1 µm.

