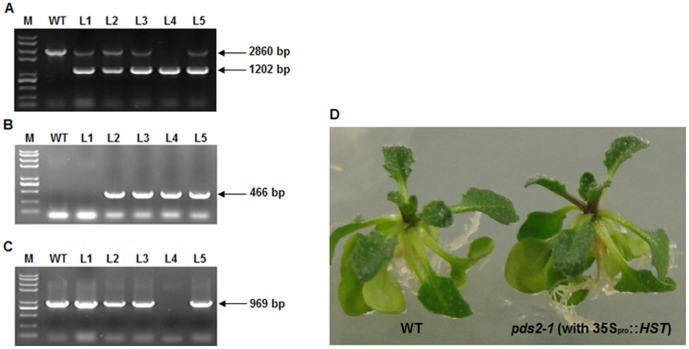
Figure 5. HST gene rescues the phenotype of pds2-1 mutant plants.
(A) PCR analysis of transgenic Arabidopsis using the HST-f and HST-r primers. The 2,860 bp band represents HST gDNA and the 1,202 bp band represents the HST coding domain sequence in transgenic Arabidopsis. M: DNA marker; WT: wild type; L1-5: five independent plants transformed with 35Spro::HST. (B) PCR analysis of transgenic Arabidopsis using the R3 and hst-g2 primers. The 466 bp band represents the T-DNA insertion in the HST gene. (C) PCR analysis of transgenic Arabidopsis using the hst-g1 and hst-g2 primers. Absence of the 969 bp band shows that L4 is a pds2-1 homozygous mutant. (D) Representative phenotype of pds2-1 homozygous plants rescued by transforming them with 35Spro::HST.

