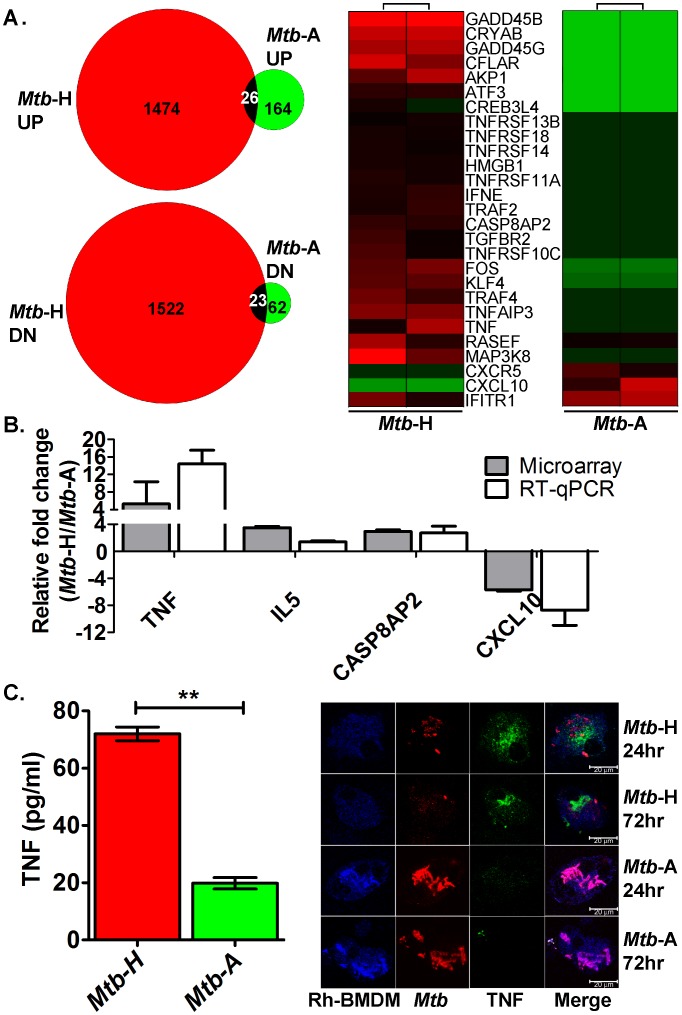
Figure 3. Immune response analysis using microarrays, RT-qPCR, cytokine assay and confocal microscopy.
(A). Microarray. Venn diagram shows the total number of genes perturbed in Mtb-H or Mtb-A infected- relative to uninfected-Rh-BMDMs. Total 226 genes (164 genes induced (UP), 62 genes repressed (DN) upon infection with Mtb-A; 2996 genes (1474 genes induced (UP), 1522 genes repressed (DN) upon infection with Mtb-H). Common genes (from up- or down-regulated gene dataset in both Mtb-H and -A group) are shown with overlap. For a description of the common genes e.g. RIPK4 [42], see Supplement S2. Heat-map clusters; green, lower expression; red, higher expression. The data are shown from independent experiments with Rh-BMDMs isolated from two Rhesus macaques. (B) RT-qPCR. The relative fold change in transcripts ( Mtb-H infected Rh-BMDM to Mtb-A infected Rh-BMDM) in microarray (grey bars) and RT-qPCR (white bars) is shown. The relative fold change values (Mtb-H to Mtb-A) microarray and RT-qPCR (within bracket) are shown below; TNF, 5.3 (14.42); IL5, 3.49 (1.38); CASP8AP2, 2.93 (2.71); CXCL10, −5.7 (−8.7). (C) Cytokine Assay and Multilabel confocal microscopy. Measurements of TNF in supernatants, Mtb-H (red) or Mtb-A (green). Experiment was performed in triplicate and values were plotted using GraphPad Prism version 6.0b. The data is statistically significant; Student’s t-test, **P = 0.0027. Confocal microscopy shows secretion of TNF (green signal) detected only in the Rh-BMDMs (blue signal) infected with Mtb-H (red signal) (top panels) at 24 hr and 72 hr. The results are shown from Rh-BMDMs derived from two rhesus macaques.

