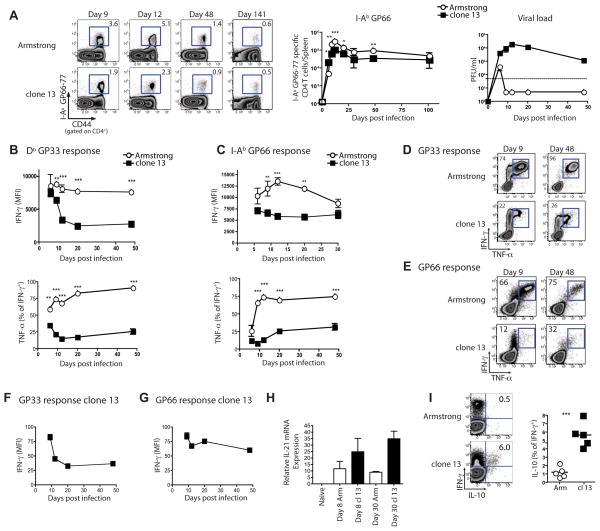
Figure 1. Kinetics of cytokine production by virus-specific CD4+ and CD8+ T cells during chronic LCMV infection.
(A) Representative flow plots of I-AbGP66 tetramer staining on the indicated days p.i. with Arm or clone 13. Numbers show percent of CD4+ T cells specific for GP66. Total number of I-AbGP66 tetramer+ CD4+ T cells in spleen during acute (open symbols) or chronic (closed symbols) LCMV infection (middle). Viral load in the serum over time p.i. with either Arm (open symbols) or clone 13 (filled symbols) (right). (B) MFI of IFN-γ in response to GP33 stimulation (top) and the percentage of IFN-γ producing cells co-producing TNF-α (bottom). (C) CD4+ T cell responses to GP66-77 as described in (B). (D and E) Representative flow plots are shown for cytokine co-production in response to GP33 (D) or GP66 peptide (E). (F and G) MFI of IFN-γ as a percentage of d6 IFN-γ MFI for CD8 (F) and CD4+ T cells (G). (H) IL-21 mRNA expression on d8 and 30 p.i. with Arm or clone 13 in sorted I-AbGP66 tetramer+ CD4+ T cells. (I) Representative plots of IFN-γ and IL-10 production by GP66-specific CD4+ T cells on d30 p.i. and summary of the percent of IFNγ-producers making IL-10. Data are representative over at least 3 independent experiments with 2–4 mice/group. Error bars indicated standard deviation. Figure 1, see also Figure S1.

