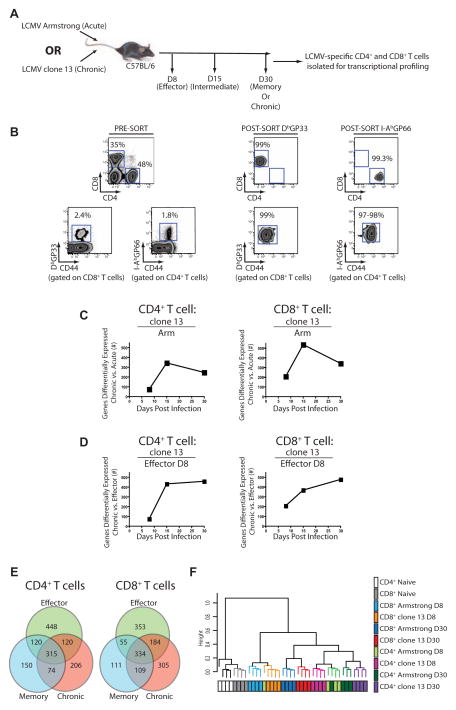
Figure 2. Transcriptional profiling of LCMV-specific CD4+ and CD8+ T cells from mice infected with Arm or clone 13.
(A) Schematic of the experimental design. (B) Pre- and post-sort purities for DbGP33-specific CD8+ T cells and I-AbGP66-specific CD4+ T cells. (C) The number of differentially expressed genes for CD4+ (left) and CD8+ T cells (right) from clone 13 compared to Arm at each time p.i. (D) The total number of differentially expressed genes from virus-specific CD4+ or CD8+ T cells from clone 13 infected mice on d8, 15, and 30 p.i. compared to d8 effector T cells from Arm. (E) Differentially expressed genes between d8 effector T cells from Arm infected mice, memory T cells from d30 p.i. with Arm and exhausted T cells isolated from d30 p.i. with clone 13. (F) Hierarchical clustering of CD4+ and CD8+ T cell responses to acute and chronic infections. Genes differentially expressed by a covariance of 0.1 were analyzed using Spearman’s correlation. Microarray data are representative of 4 independent samples per time point. Figure 2, see also Figure S2 and Table S1.

