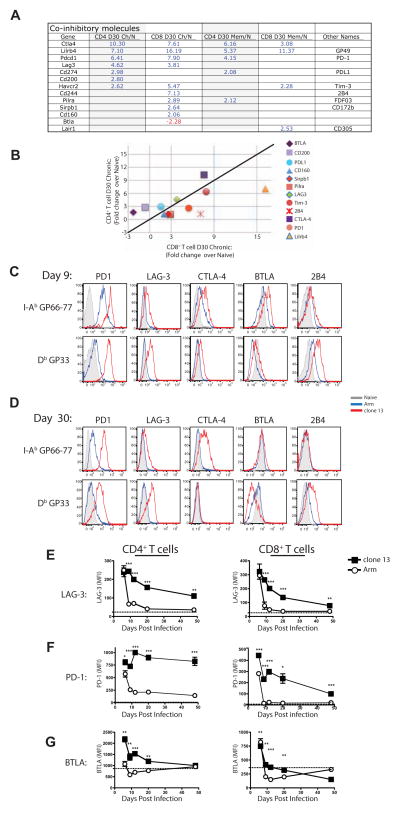
Figure 4. Inhibitory receptor expression by exhausted CD4+ and CD8+ T cells.
(A) Genes encoding coinhibitory receptors differentially expressed by memory and exhausted virus-specific T cells. (B) Fold change in expression of coinhibitory receptors by exhausted T cells at d30 p.i. compared to naïve T cells. (C and D) Representative histograms showing expression of coinhibitory receptors (PD-1, LAG-3, CTLA-4, BTLA, and 2B4) on LCMV-specific CD4+ and CD8+ T cells on d9 (C) or d30 (D). Histograms depict naïve T cells (CD44Lo; grey) or virus-specific T cells from Arm (blue) or clone 13 (red) infection. (E, F and G) MFI of LAG-3 (E), PD-1 (F) and BTLA (G) expression by LCMV-specific CD4+ (left) or CD8+ (right) T cells. Data are representative of 3–8 independent experiments with at least 3 mice per group at each time point. Error bars represent standard deviation. Figure 4, see also Figure S4 and Table S2.

