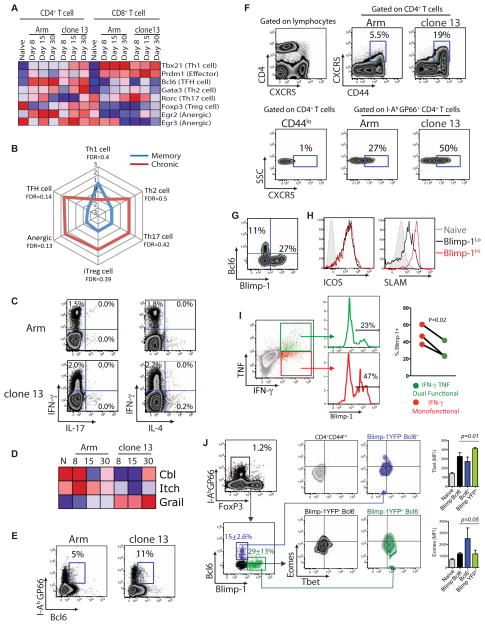
Figure 7. T helper cell lineage differentiation during clone 13 infection.
(A) Heatmap of expression of TFs associated with distinct T helper cell lineages in LCMV-specific CD4+ and CD8+ T cells. (B) GSEA of exhausted versus memory CD4+ T cells with signatures from the specified Th cell subsets. Normalized enrichment scores (NES) are plotted. Red = clone 13. Blue = Arm. Using an FDR score of 0.01 there was no significant enrichment of any subset for exhausted CD4+ T cells. (C) Representative flow plots show IL-4 or IL-17 production following peptide stimulation and ICS (gated on CD4+ T cells). Numbers show the percent of CD4+ T cells expressing cytokines. (D) Heatmap of Cbl, Itch and Grail expression by LCMV-specific CD4+ T cells. (E) Representative flow plots of Bcl6 expression by CD4+ T cells at d30 p.i. with Arm or clone 13. Numbers show the percent of I-AbGP66+ CD4+ T cells expressing Bcl6. (F) CXCR5 expression by total and IAbGP66+ CD4+ T cells. Numbers show the percentage of cells expressing CXCR5. (G) Representative plots of Blimp-1-YFP versus Bcl6 expression in I-AbGP66+ CD4+ T cells at d30 p.i. with clone 13. (H) LCMV-specific CD4+ T cells from Blimp-1-YFP mice were examined for expression of ICOS and SLAM at d30 p.i. with clone 13. I-AbGP66+ CD4+ T cells were gated for low or high Blimp-1 expression then examined for ICOS or SLAM expression. (I) Blimp-1-YFP mice were infected with LCMV clone 13 and on d30 p.i. ICS was performed with GP66 peptide stimulation followed by staining for IFN-γ and TNF. Dual functional (IFN-γ+TNF+) and monofunctional (IFN-γ+ only) virus-specific CD4+ T cells were then examined for Blimp-1-YFP expression. P-value determined using a paired T-test. (J) Representative flow plots of TF expression in I-AbGP66+ CD4+ T cells at d30 post infection with LCMV clone 13. Foxp3- I-AbGP66+ CD4+ T cells were separated into 3 distinct populations (Blimp-1+Bcl6−, Blimp-1−Bcl6−, Blimp-1+Bcl6+) then examined for expression of Eomes and Tbet. Numbers represent the percentage of cells expressing the marker with standard deviation. Statistical relevance was determined using two-way ANOVA. Data are representative of 2–5 independent experiments with at least 3 mice per group at each time point. Error bars represent standard deviation. Figure 7, see also Figure S6.

