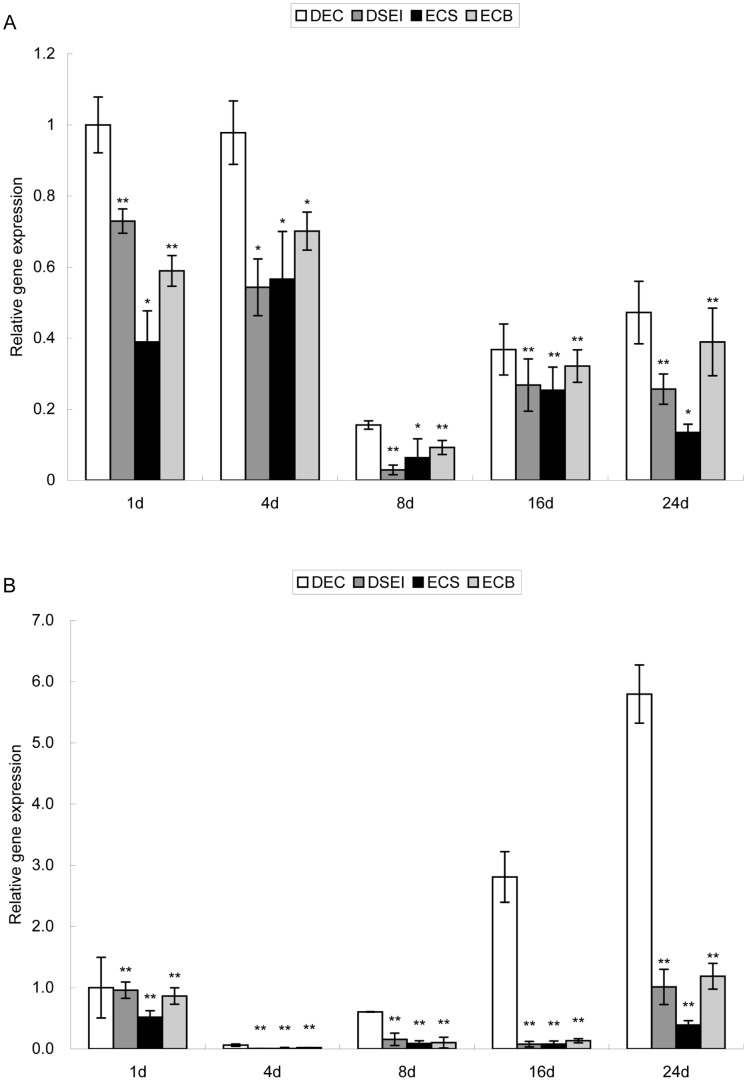
Figure 7. Expression of EsXTH1 (A) and EsPLT1 (B) genes in DEC, DSEI, ECS and ECB.
Results were an average of three biological replicates ± standard error. Genes were normalized using actin and tubulin as housekeeping genes. Gene expression on the first day of culture was used as the control. Statistically significant differences are indicated (* P<0.05 and ** P<0.01 by two-tailed t-test and one-way ANOVA).

