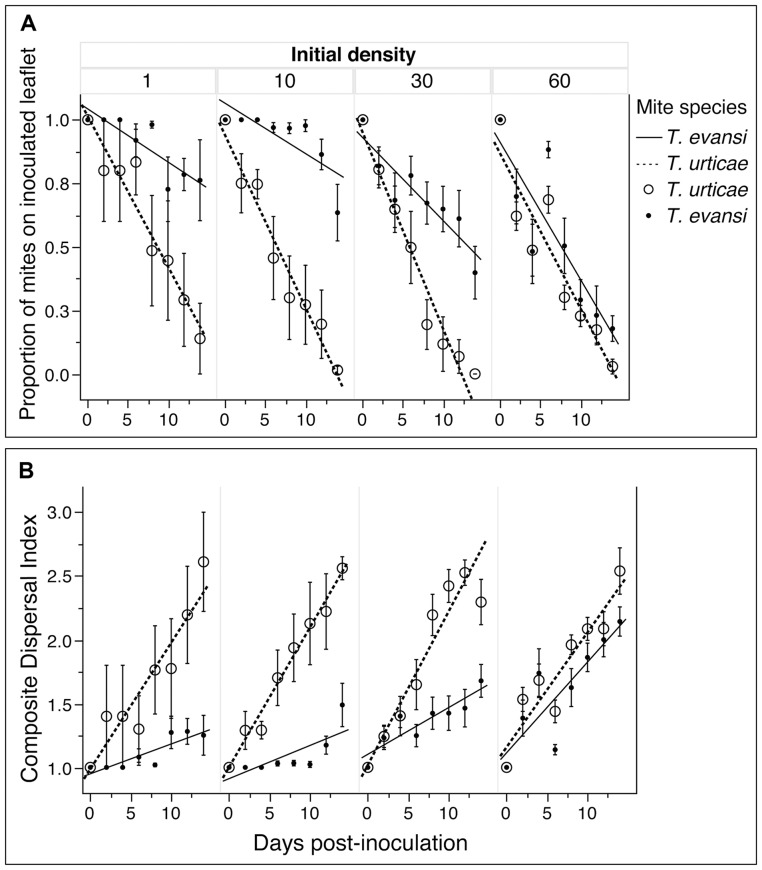
Figure 1. Within leave distribution of T. evansi and T. urticae.
(A) Proportion of Tetranychus evansi and T. urticae on inoculated leaflet over 15 days relative to the initial density; (B) Composite Dispersal Index summarizing mites position on the leaf relative to the initial density. The error bars indicate the standard errors.

