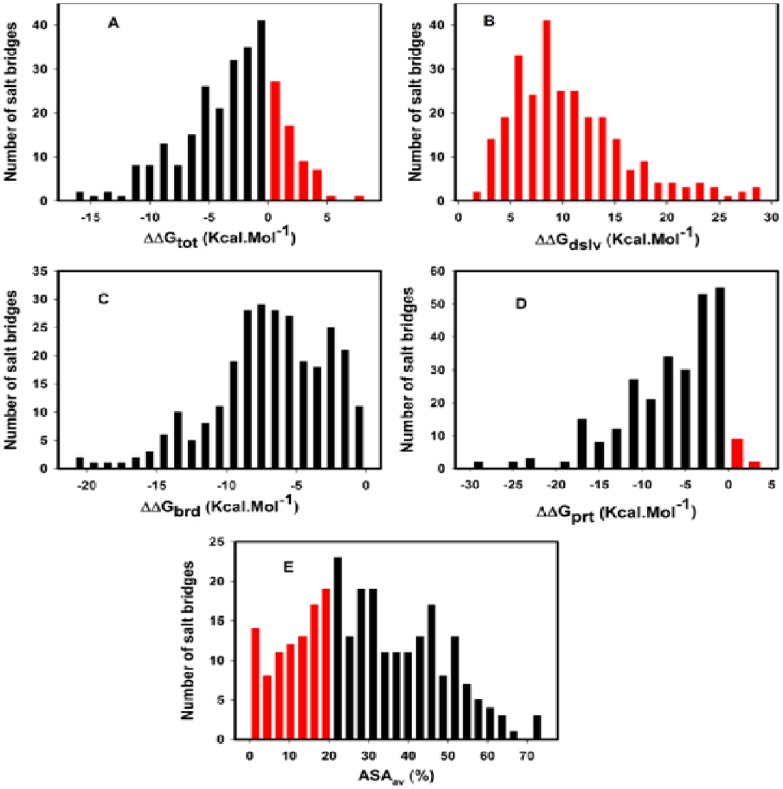
Figure 3. Histogram showing distribution of 275 salt-bridges from 20 halophilic proteins extracted using SBION [53] as a function of ΔΔGtot Kcal Mol−1 (A), ΔΔGdslv Kcal Mol−1 (B), ΔΔGbrd Kcal Mol−1 (C), ΔΔGprt Kcal Mol−1 (D) and ASAav (%) (E).
Figure (A) through (D), black bar indicates stabilizing (i.e. ΔΔGtot<0) and red bar indicates destabilizing (i.e. ΔΔGtot>0) salt-bridges. Figure (E) red bar (ASAav%≤20) indicates salt-bridges present in the core.

