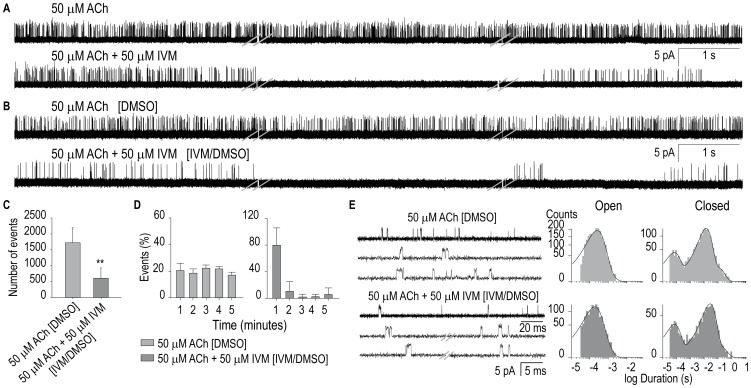
Figure 4. Modulation of L-AChRs of L1 muscle cells by ivermectin.
(A) Single-channels activated by 50 µM ACh were recorded in the absence (top) and presence of 50 µM IVM in the pipette solution (bottom). Three different traces are shown for each condition and correspond to the recording during the first, third and fifth minute. (B) Representative traces of single-channels activated by 50 µM ACh were recorded in the absence (top) and presence of 50 µM IVM in the pipette solution (bottom) from cells previously incubated with 0.1% DMSO (top) or 50 µM IVM in 0.1% DMSO (bottom). In brackets it is indicated the pre-incubation condition (0.1% DMSO for the control and 0.1% DMSO plus 50 µM IVM. (C) Comparison of the number of opening events in the first 30 seconds of recording as in (B). ** p<0.01 (Student t-Test). (D) Bar chart showing the percentage of opening events per minute during the first 5-min recording as in (B). The data correspond to five different recordings for each condition. (E) Representative traces and open and closed time histograms of channels recorded as explained in Panel B. Traces are shown at two temporal scales. Pipette potential: +100 mV. Filter: 9 kHz.

