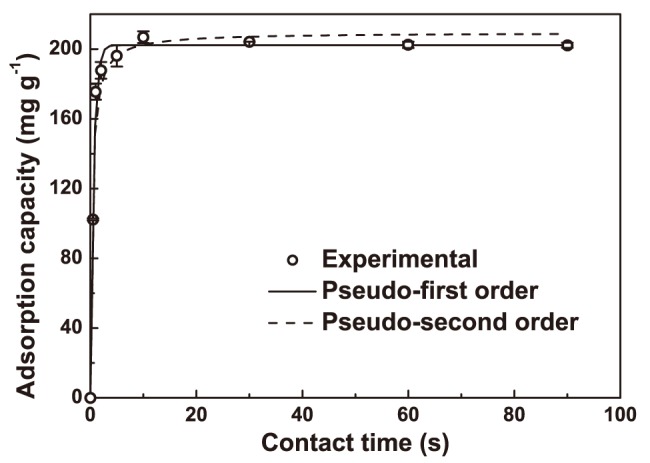
Figure 1. Kinetic models fitted with the data of adsorption conducted under the optimized conditions (i.e., 0.2 g of biomass, 1000 mg L−1 of initial oil concentration, 35°C, 100 rpm of agitation speed, and 7.5 of initial pH) in a period of 90 s.

The bars represent the standard errors.
