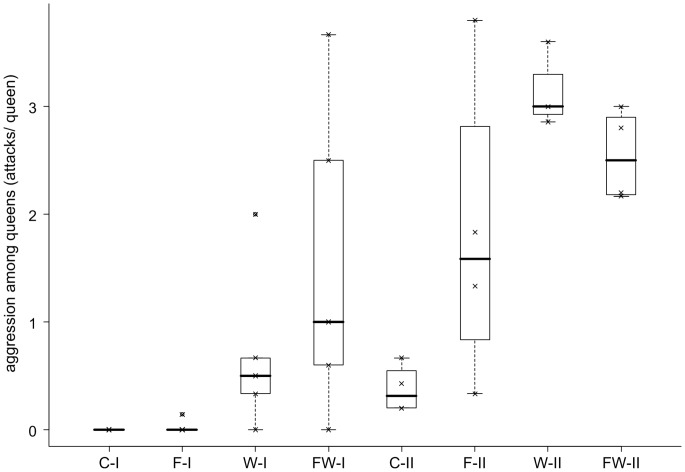
Figure 1. Frequency of aggression among queens of the ant Leptothorax acervorum from a low-skew population.
Data shown as attacks per queen during the total observation period (median, quartiles, range). Individual colonies were subjected to different types of stress (food reduction F, worker reduction W, or both FW) or left unmanipulated (control C) in two different seasons (July, I, and September, II). Outliers are indicated as ◯ and original data points as ×.

